Headlines
La Nina rainfall anomaly pattern evident across tropics from Indian Ocean to Americas
Floods and landslides across Maritime Continent, Philippines, Sri Lanka and Australia related to effects of this weak La Nina.
Drought conditions along U.S. east coast lead to wildfires
Weak La Nina features are evident in the tropical Pacific for November 2024 with the Nino 3.4 SST index for the month slightly negative at about -0.3C and the precipitation anomaly pattern for the month showing some aspects of a typical La Nina. Figure 1 shows the global precipitation map for November 2024, the precipitation anomaly from climatology for the month and the composite La Nina anomaly map for November. The strong negative anomaly feature along the Equator at about 160°E in the middle panel is similar in location to that in the composite La Nina figure with a narrow fragmented negative feature extending to the east, almost to the coast of the Americas, above the Equator. To the north of that feature is a variable positive anomaly paralleling the narrow negative feature, indicating a slight northward displacement of the ITCZ. In the Pacific, further south the anomaly features for this month and the composite also show some correspondence over the mid-latitudes.
Further west over the Maritime Continent, the Philippines and the eastern Indian Ocean, a large area of positive rain anomalies existed in November (Fig. 1, middle panel), again consistent with the La Nina composite. Tropical cyclones contributed to this large-scale feature significantly, especially in the region of the Philippines. At one point in the middle of the month four tropical cyclones were prowling the western Pacific and South China Sea, apparently a record for November. When these storms hit land they caused heavy rains and floods, for example in the Philippines. Flooding and landslides from a weak tropical system also hit northeast Sri Lanka causing 12 deaths and continuing into southeast India. At the very end of the month heavy rains caused havoc in very southern Thailand and Malaysia. Even in the South Indian Ocean a tropical cyclone tracked across the area. And Australia was largely covered by positive rainfall anomalies with heavy rains and flooding in parts of Queensland. The effect of the large-scale La Nina circulation certainly contributed to the enhanced rainfall in this large region and these accompanying smaller-scale disasters.
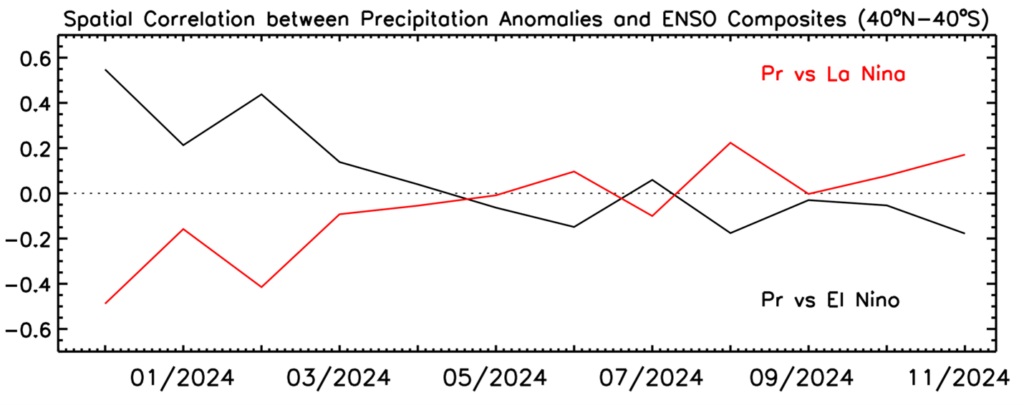
Even further west the western Indian Ocean and the Horn of Africa are dry, again matching the La Nina composite. Otherwise the pattern over Africa with positive anomalies over the tropical eastern portion, with landslides in Uganda, is not seemingly connected to La Nina. The overall pattern correlation between this month’s anomaly pattern and the La Nina composite increased a bit for November, but remained positive, but weak (see Fig. 2).
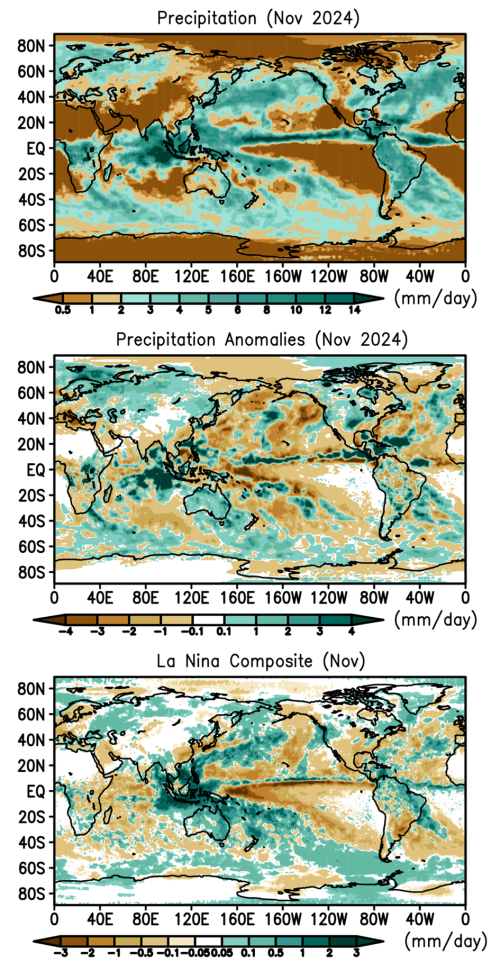
Western Europe is also drier than normal, although Malaga, Spain, along the south coast, suffered a flash flood, possibly linked to the very warm waters of the Mediterranean. Central America and the Caribbean have positive anomalies, partly associated with late season tropical cyclones, along with a dry Mexico and southwest U.S., all similar to the typical La Nina pattern.
The central and northwest U.S. were wetter than normal, but the east coast from Florida to Maine was relatively dry and on the edge of drought, with non-typical wildfires in Maryland, New Jersey and New York.
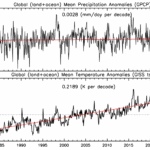
Despite the ongoing weak La Nina, Fig. 3 shows global surface temperatures above the trend line and the global precipitation (land + ocean) above the long-term mean. Table 1 shows that the overall positive anomaly is primarily coming from the anomaly over land, typical of La Nina conditions.
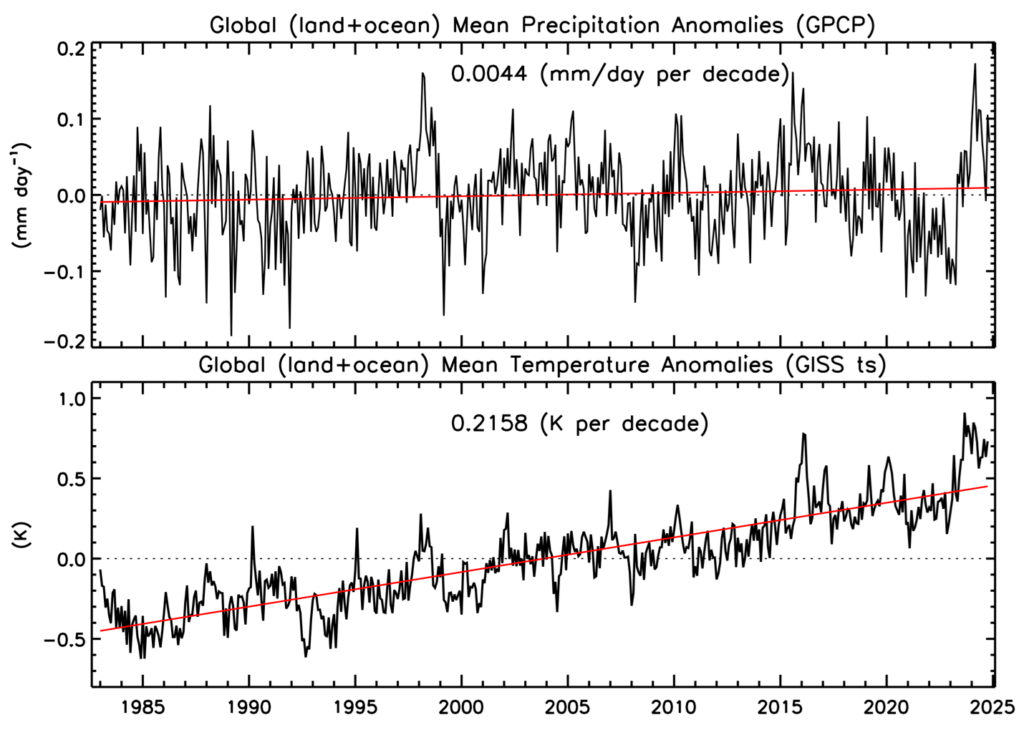
Table 1 Global precipitation and anomalies in November 2024.
| Mean Precipitation (November 1983-2023) | Precipitation (November 2024) | Precipitation anomaly (November 2024) |
Land+ocean | 2.80 | 2.87 | +0.07 |
Land | 2.05 | 2.25 | +0.20 |
Ocean | 3.11 | 3.13 | +0.02 |


