Headlines:
- Record-setting global surface temperature associated with record (or near record) global precipitation amount, despite absence of major El Nino
- El Nino to weak La Nina precipitation pattern transition during the year
- The 2024 anomaly pattern again reinforces long-term precipitation trend pattern
The year 2024 achieved a record high surface temperature anomaly (1.28C) above a recent climatological baseline according to NASA and NOAA, even though the year did not get an extra warm push from a lengthy El Nino. The average Nino 3.4 SST Index for 2024 was +0.35, only slightly on the El Nino side. On the global precipitation side, we also reached an estimated high value in 2024, which often is accompanied by El Nino conditions—see Fig. 1. The 2024 estimate contains some preliminary data and may need to be adjusted slightly later. But it is clear that the global totals for 2024 are both (surface temperature and precipitation) high and the precipitation estimates are large over both land and ocean (see Table 1).
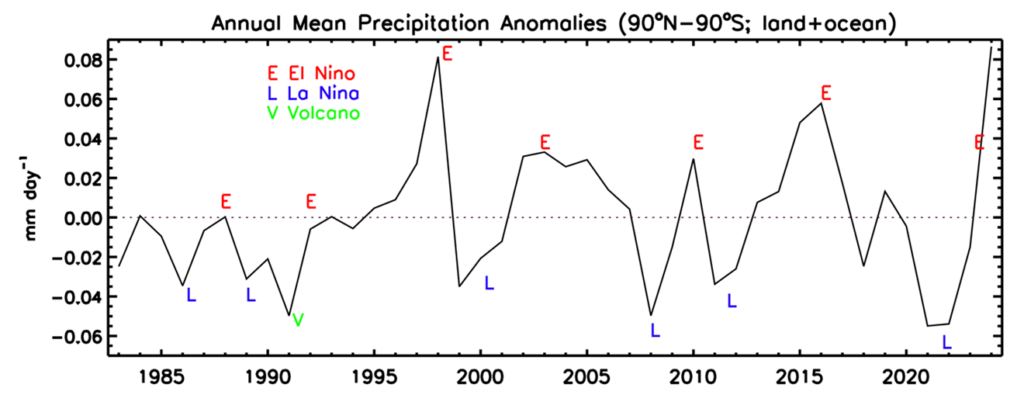
Table 1. GPCP V3.2 Global (and Land and Ocean) Estimates Compared to Climatology
| 1983-2023 | 2024 | Difference |
Land+Ocean | 2.81 | 2.90 | +.09 |
Land | 2.18 | 2.28 | +.10 |
Ocean | 3.07 | 3.16 | +.09 |
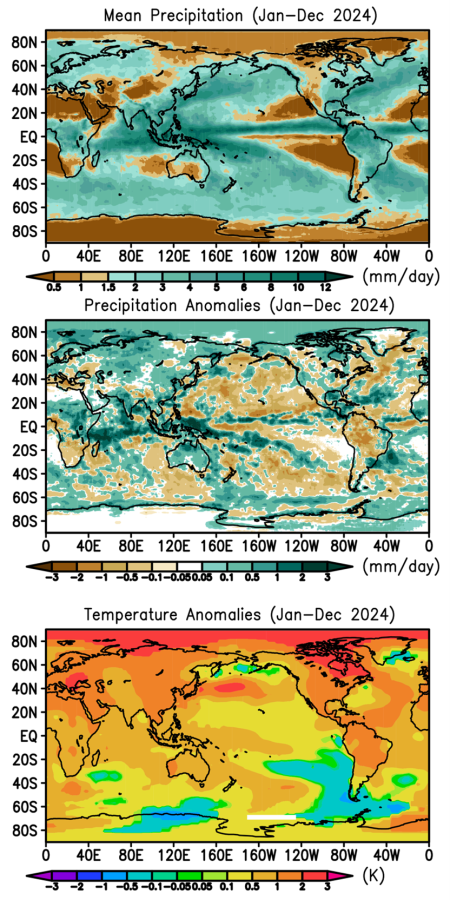
Figure 2 shows the global precipitation map for 2024 (top panel) with the usual maxima evident in the tropics and mid-latitudes and the relatively dry sub-tropics. The anomaly map for the year (middle panel) shows a somewhat scattered pattern of wetter and drier than average features that are a result of various inter-annual and trend forces, related to ENSO and global warming. The surface temperature anomaly map (bottom panel) has a very different look with positive anomalies dominating, but some interesting variations associated with the precipitation anomalies.
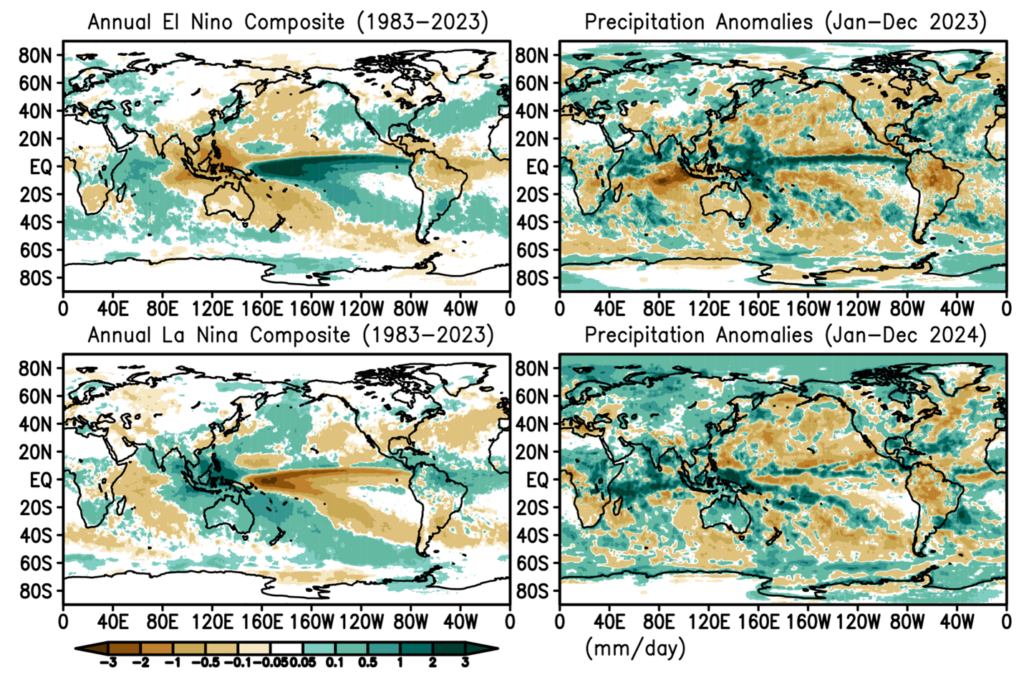
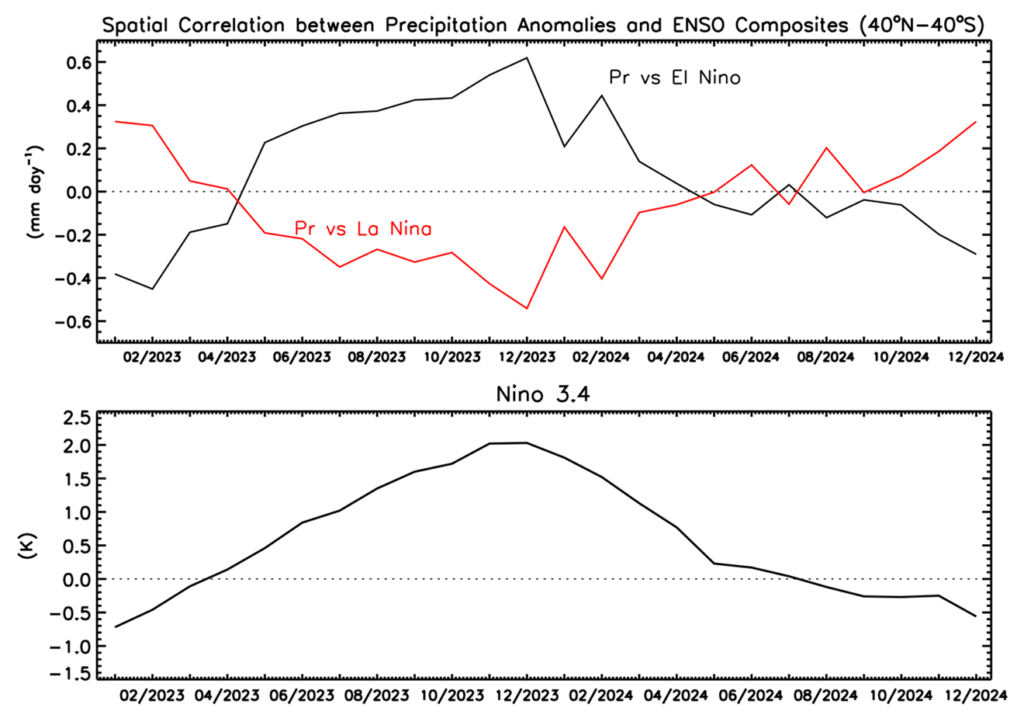
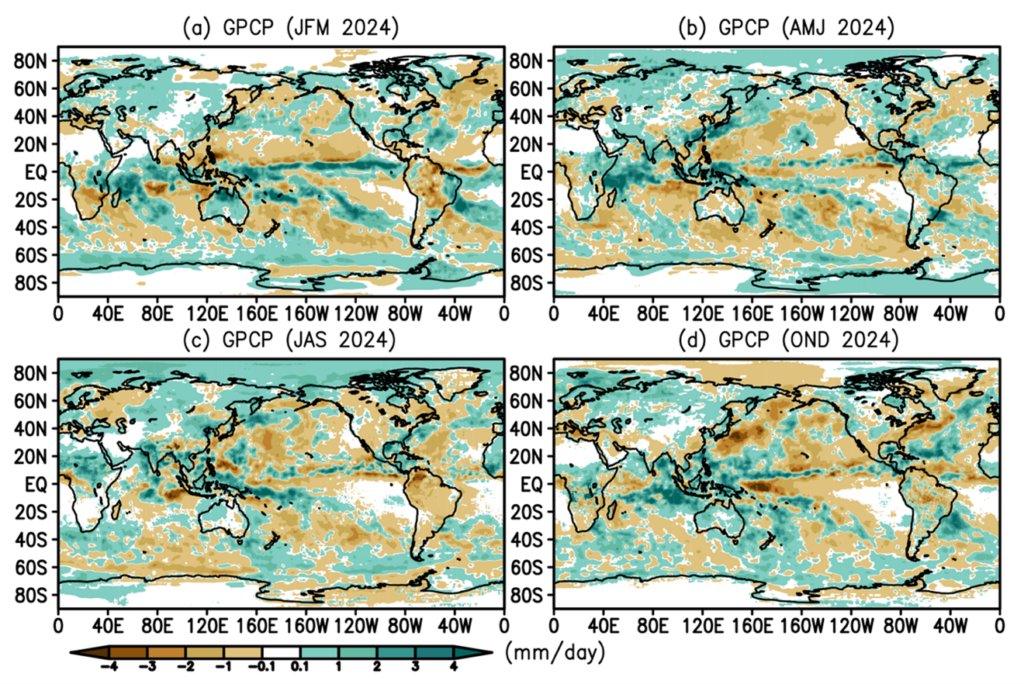
But the dominant force in precipitation anomaly maps is often ENSO and Fig. 3 has the El Nino/La Nina composites compared to the anomaly maps for 2024 and its preceding year 2023. Figure 4 has the plot of the Nino 3.4 SST Index and the monthly correlations between the rainfall anomaly fields and the two composites (for their respective months). The year 2023 spent its time with increasing El Nino conditions (Fig. 4) and its anomaly map (Fig. 3) bears a resemblance to the El Nino composite. Entering 2024 the El Nino dissipated over the first few months and entered neutral or weak La Nina conditions. The resulting 2024 anomaly map is nearly uncorrelated to ENSO. The anomaly maps for the quadrants of the calendar year are shown in Fig. 5 and reflect the El Nino to weak La Nina change during the year with the strong central Pacific equatorial positive anomaly in the beginning months of the year and the distinct negative feature in the western Pacific and the overall wet anomaly over the Maritime Continent, eastern Indian Ocean and Australia for the last three months.
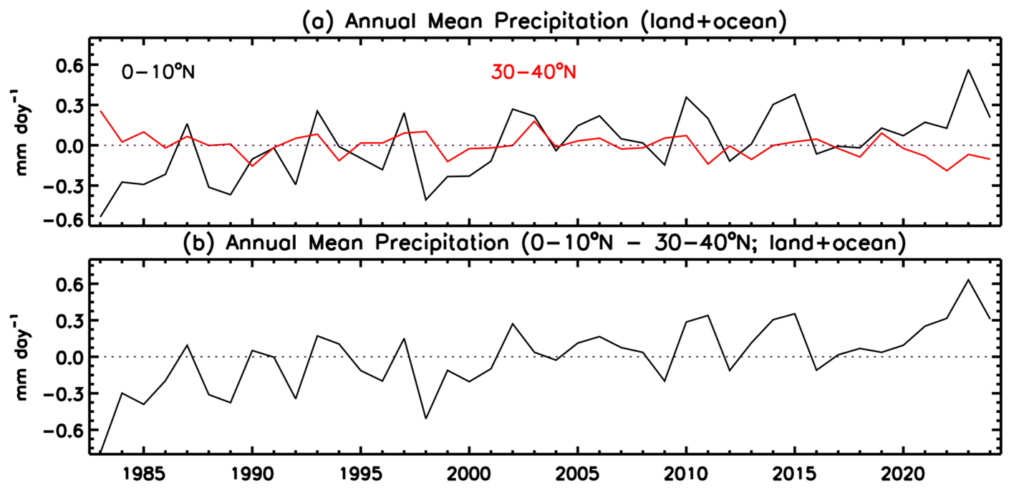
Going back to the anomaly field for all of 2024 (e.g., Fig. 1) there are some important features related to the ENSO variations and the record global temperature. Across the tropics much of the Indian Ocean, South Asia, Western Pacific and Australia were wetter than normal with some tendrils extending along the ITCZ and the northern edge of the SPCZ. Africa was split in two with the north being wet and the south being dry. South America was dry again this year, especially over the Amazon (check out 2023 in Fig. 3), continuing the drought there. The sub-tropical oceans are generally drier than normal and the northern land areas, especially Asia, are wetter than average. Zonally-averaged anomalies over tropical oceans have a positive and over mid-latitude oceans a negative anomaly. A continuation of “wet-getting-wetter and dry-getting drier.” Where this can be seen dramatically is in Fig. 6 looking at the trends over the ITCZ region (0-10°N and 30-40°N land+ocean) where trends are obvious. Here 2024 has dropped somewhat from 2023, but is still near a peak in ITCZ rainfall and dryness in mid-latitude.
Over North America the southwest is dry and the northwest had a surfeit of precipitation. The Gulf of Mexico, Caribbean and adjacent western Atlantic are rainier than usual, perhaps related to the high SSTs in this area (Fig. 1, middle panel) producing more regional evaporation and fuel for rainfall. A similar T/P connection may be related to the Indian Ocean, western Pacific and SPCZ positive anomalies, and even perhaps with the SST feature east of Japan. These regional ocean temperature “hot spots” may be leading to regional rainfall increases and help to produce the 2024 global precipitation peak without a strong El Nino.
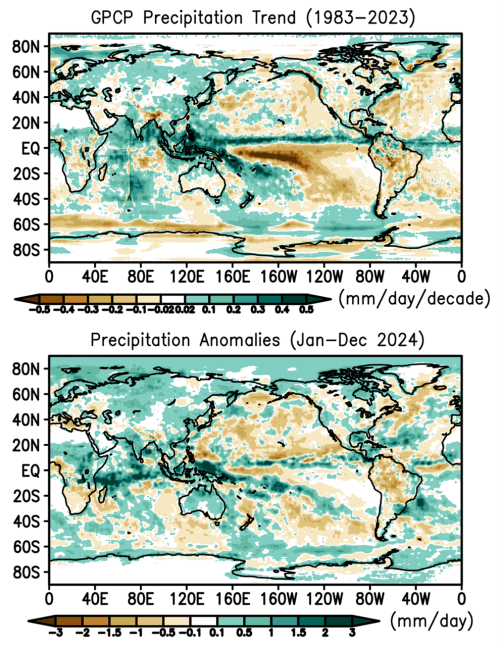
Global warming certainly affects long-term global precipitation patterns (Gu and Adler, 2023, 2024) along with ENSO on a year-to-year basis. These and other factors conspire to produce the global precipitation magnitude and pattern of anomalies in any one year. For 2024 Fig. 7 shows the GPCP trend map through 2023 and (again) the anomaly map for 2024. There is a weak resemblance between the two: increases over northern Asia, central Africa, Indian Ocean, Western Pacific; decreases over various sub-tropical oceans, South America and the southwest U.S. and Mexico. The spatial correlation between the two fields (40°N-40°S) is +0.23, similar to the same calculation for 2023 during mostly El Nino conditions. This means, of course, that the anomalies for these individual years are reinforcing the longer-term trend pattern associated with global warming.
The record global warmth in 2024, even without a significant El Nino, may be affecting evaporation and precipitation to produce both a large global precipitation total and continuing to push the precipitation trend pattern along directions associated with global warming.
Global Precipitation Climatology Project (GPCP) V3.2 Monthly Analysis
This annual distribution of global precipitation is analyzed using the Global Precipitation Climatology Project (GPCP) monthly data set (Version 3.2), which is a long-term (1983-2024) analysis (Huffman et al., 2023) using a combination of satellite and gauge information. An interim GPCP analysis completed within 10 days of the end of the month allows for use in climate monitoring and, in this case, an examination of the just completed year.
References
Huffman, G. J. and R. Adler, A. Behrangi, D. Bolvin, E. Nelkin, G.Gu and M. Ehsani, 2023. The New Version 3.2 Global Precipitation Climatology Project (GPCP) Monthly and Daily Precipitation Products. J. Climate, 36, 7635- 7655. DOI: 10.1175/JCLI-D-23-0123.1.
Gu, G., and R. Adler, 2023. Observed Variability and Trends in Global Precipitation During 1979-2020. Climate Dynamics, https://doi.org/10.1007/s00382-022-06567-9
Gu, G. and R. Adler, 2024. Variability and Trends in Tropical Precipitation Intensity in Observations and Climate Models. Climate Dynamics, https://doi.org/10.1007/s00382-024-07287-y.


