")
Headlines
The global La Nina precipitation anomaly pattern stays strong, lagging the weakening SST evolution during February
Tropical cyclones and their rainfall patterns contribute significantly in the Southwest Pacific and South Indian Oceans
The global precipitation number goes just about neutral, while global surface temperature remains high, even significantly above its long-term trend line
As we finish up northern hemisphere winter in February the southern hemisphere is in late summer and its oceans have been active, with six total tropical cyclones at one point in time, three in the South Indian Ocean and three more in the western South Pacific Ocean. The last time for that many active cyclones was 1989, during—guess what—a strong La Nina. The standard Nino3.4 was -0.6C for this January, although the relative Nino3.4 of -1.1C (RNino3.4, with a more current background SST, see information at NOAA’s Climate Prediction Center[CPC]) might give a better estimate of ENSO’s status. Even with that monthly mean, SSTs in the key Nino3.4 area have warmed rapidly during the month and we may be headed for La Nina extinction.
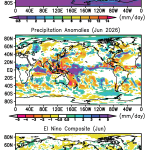
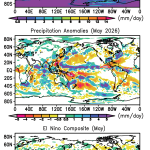
But the precipitation patterns (see Fig. 1) show a weak mean ITCZ across the central Pacific and a very intense negative anomaly (middle panel) still poised around 180° longitude just south of the Equator. That’s still a definite La Nina signal, but one should keep in mind that the precipitation pattern typically lags the SST pattern by about a month. An adjacent positive rain anomaly, oriented NW to SE is located between Australia and the dry anomaly. That’s where all those Pacific cyclones were located in the past month. Over in the Indian Ocean the cyclones there contributed to the positive rain anomalies off the northwest coast of Australia and off the southeast coast of Africa and Madagascar. The tropical cyclones and even weaker systems managed to edge into the Australian coasts causing serious flooding (800 mm of rain) in Townsville, in northeast Australia, very early in the month and in other locations too, including along the northwest coast. The monthly anomaly map over the continent shows these features, but with the rest of Australia staying dry. Further west the TC’s skirted around Madagascar with some flooding as part of the roughly typical La Nina anomaly pattern of dry conditions in the Horn of Africa and a bit further south, and then a sharp reversal toward Mozambique and South Africa. Associated floods in Botswana left seven dead.
Over the Maritime Continent the typical La Nina positive rain anomaly is there generally, but is very variable regionally with wet conditions over the South China sea and the Philippine Islands. Over southwest China there was a very small area of distinct positive rainfall anomaly associated with a rain-induced landslide with over a 1 km length that killed 30 people. Otherwise China was dry, especially in eastern China and extending eastward to Japan and an unusual wildfire along the northeast coast of the main island of Honshu, the largest in last 30 years. This dry feature also is typical of La Nina (compare to bottom panel).
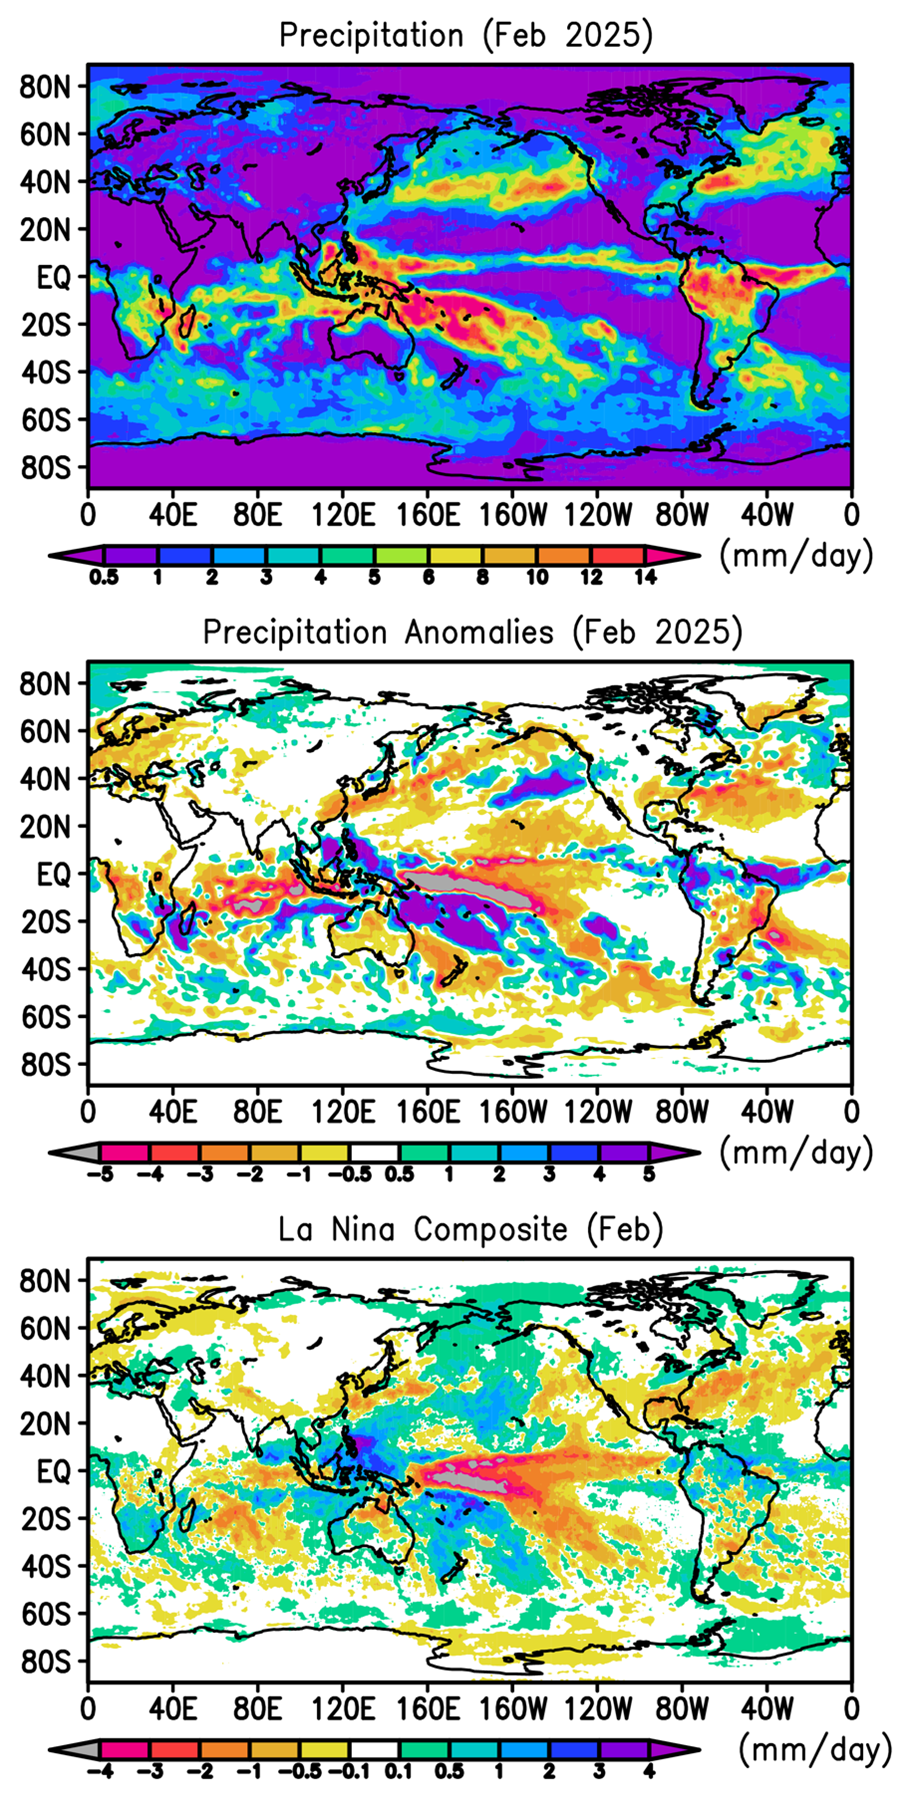
South America in February was wet in the northwest and dry in the southeast, with a heat wave in southeast Brazil and Argentina contributing to the much longer drought in that continent. This wet/dry arrangement fits the La Nina composite. But on top of this general pattern, the SSTs right along the coast of Peru and a little further to the west have increased rapidly during February into a strong positive anomaly, developing into what is sometimes called a Coastal El Nino. A positive rainfall anomaly can also already be seen there and in past similar events Peru has suffered floods and landslides. How this more local phenomenon will fit into the larger ENSO evolution (or not) will be something to watch. Also, the February mean month and the anomaly field already show early evidence of the seasonal double ITCZ in the far eastern Pacific.
North America shows precipitation excess for February over the northwest U.S, and even the Los Angeles area received some rainfall that caused limited mudflows in burn scar areas. The Rocky Mountains did receive some snow, but remain below normal for the winter, especially in southwest Colorado, causing concern for downstream water resources in the coming months and for the local fire season. This lack of precipitation is typical for the wintertime La Nina condition and covers most of the southern U.S. Further east a swath of positive anomaly from the midwest U.S. toward the east coast was related to very serious floods in Kentucky, Tennessee, West Virginia and Virginia that killed 20 people.
The Atlantic ITCZ was wetter than average with a dry sub-tropics to the north, similar to the La Nina composite. Over Europe conditions were almost uniformly dry adding to the drought affecting central Europe and to the east. Again this dryness matches the La Nina composite, seeming to indicate La Nina’s reach.
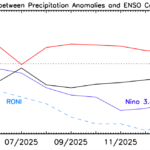
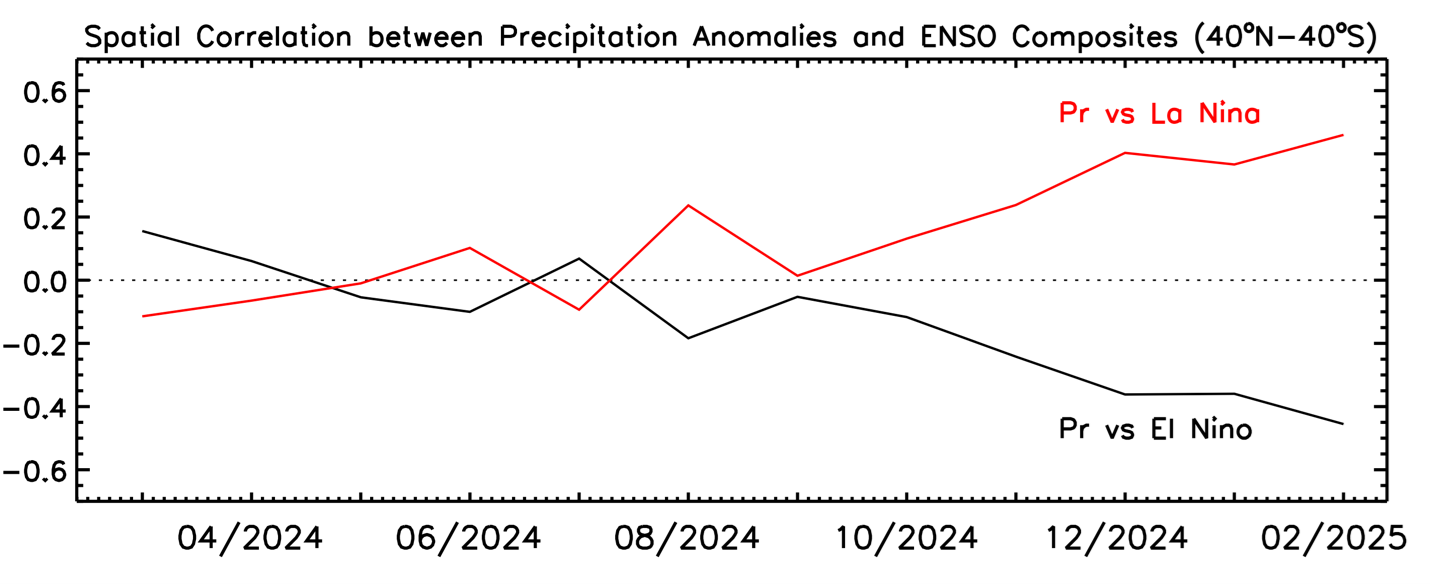
In fact, when the spatial correlations between the monthly anomaly rainfall patterns are compared to the La Nina composites (Fig. 2) the pattern correlation has reached a maximum, indicating the strength of this ENSO feature, even while the SST pattern in the central Pacific seems to have weakened during February. Keeping in mind the lag between SST and rainfall patterns, we may see a beginning of a dramatic change in March.
On a global scale Fig. 3 and Table 1 indicate that the global total precipitation (land+ocean) is just below the long-term mean, while the global surface temperature continues at near record levels. The global precipitation mean being below normal fits the La Nina usual situation, although the land/ocean split does not. As we presumably exit this La Nina in the next few months it will be interesting to see where both the global temperature and global precipitation end up under forecast neutral ENSO conditions.
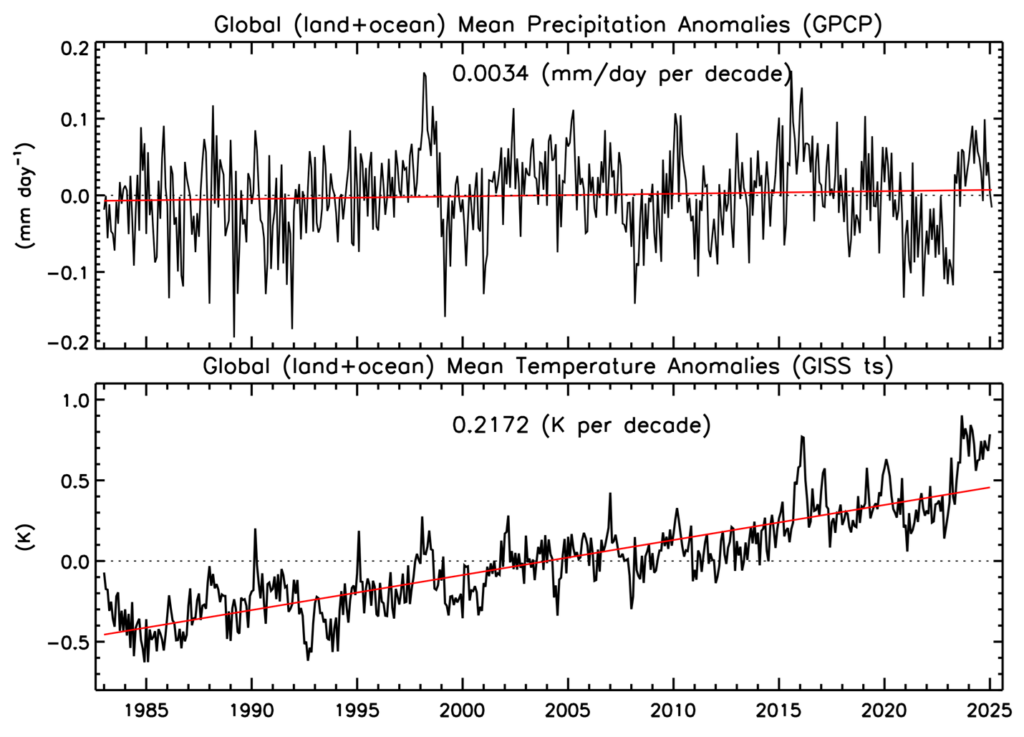
Table 1 Global precipitation and anomalies in February 2025.
| Mean Precipitation (February 1983-2024) | Precipitation (February 2025) | Precipitation anomaly (February 2025) |
Land+ocean | 2.78 | 2.76 | -0.02 |
Land | 2.13 | 2.07 | -0.06 |
Ocean | 3.06 | 3.06 | +0.00 |