Meteorological Summer has gotten off to an active start, with deadly flash flooding striking Texas and West Virginia over the past several days. In total, at least 20 people have lost their lives. The cause for flash flooding can be linked to a moisutre-laden air mass combined with slow-moving frontal boundaries, allowing for training rounds of convection to develop. A multi-day heavy rain threat was forecasted by the NWS Weather Prediction Center in the Days 4-7 Extended Forecast Discussion issued on the morning of 08 June for 1200 UTC 11 June through 1200 UTC 15 June 2025: “Guidance continues to converge of central Texas into Oklahoma for multiple days of heavy rainfall, with parts of this area already primed from recent rainfall.” Additionally, a Day 5 Excessive Rainfall Outlook (ERO) was issued for the 24-hour period ending Thursday, 1200 UTC 12 June 2025, highlighting a Slight Risk of rainfall exceeding flash flood guidance within 25 miles of a point across central Texas. By Day 1, a Moderate (At Least 40%) ERO was in place across much of central and eastern Texas.


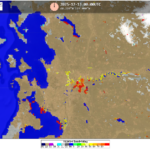
The NESDIS/Office of Satellite and Product Operations (OSPO) Blended Total Precipitable Water (bTPW) Percent of Normal product from ~1500 UTC 10 June to ~2000 UTC 11 June 2025 showed the extremely moist environment in place, with bTPW values averaging 100 to 150 percent of normal across Texas. During early June, these above-average values equate to quite high PW values, near 2.00″ as depicted in the OSPO Advected Layered Precipitable Water (ALPW) product. An animation of the ALPW product shows a surge of Gulf moisture in the Surface-850 hPa and 850-700 hPa layers, with a possible connection at the upper levels to Tropical Storm Barbara and its remnants as it pushed towards the southern tip of Baja California Sur.


GOES-East 1-minute Mesoscale Clean IR Longwave Window Band 13 imagery on 11 June tracked a slow-moving complex of thunderstorms tracking from eastern Texas to western Louisiana. Towards the end of the animation, you’ll also notice a new round of convection farthering further west across Central Texas.
Figure 6: GOES-East Band 13 Mesoscale imagery from ~1530 to ~2030 UTC 11 June 2025. This video was created from AWIPS, and display files can be shared upon request.
The driver for the convection can be well identified in the Upper-Level Water Vapor imagery from the evening of 11 June to the morning of 12 June, with a clear curvature signature of a digging upper-level trough seen across the Southern Plains. By ~0300 UTC 12 June, deep convection can be seen exploding across much of central and eastern Texas.
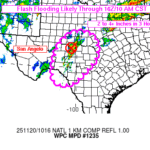
A Mesoscale Precipitation Discussion (MPD) was issued by the Met Watch Desk around this time noting ‘The threat of flash flooding is expected to increase toward the south with time and a few spots of 3 to 6+ inches may lead to significant/considerable impacts’ as ‘GOES East water vapor imagery showed the southern end of a mid to upper-level low over west-central TX along the northern end of the Edwards Plateau near the Colorado River at 0230Z’.
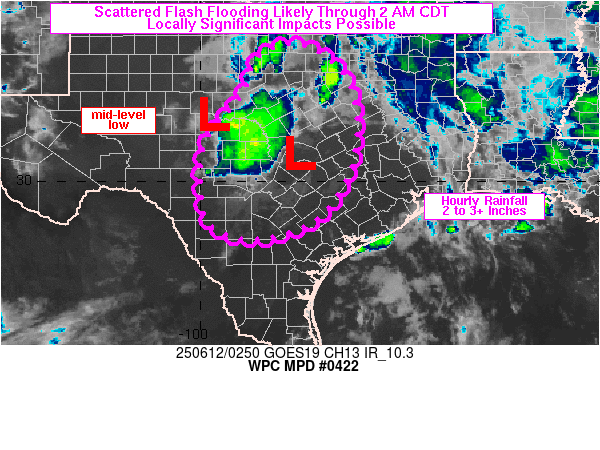
GOES-East Mesoscale Clean IR imagery from 0500 to 0815 UTC 12 June 2025 tracked the expanding, training intense convection from San Antonio to east of Waco, with a separate convective area from Bay City to Houston. The Weather Forecast Office (WFO) for Austin/San Antonio issued a Flash Flood Warning at 0132 UTC for San Antonio for ‘Life threatening flash flooding. Thunderstorms producing flash flooding.’. The rainfall resulted in a Record Daily Rainfall Maximum of 6.11 inches, breaking a record of 3.26 inches set in 1973, with most falling in the early morning hours. The flash flooding in San Antonio resulted in 13 deaths.
Figure 9: GOES-East Mesoscale Clean IR imagery from 0500 to 0815 UTC 12 June 2025. From CIRA Slider
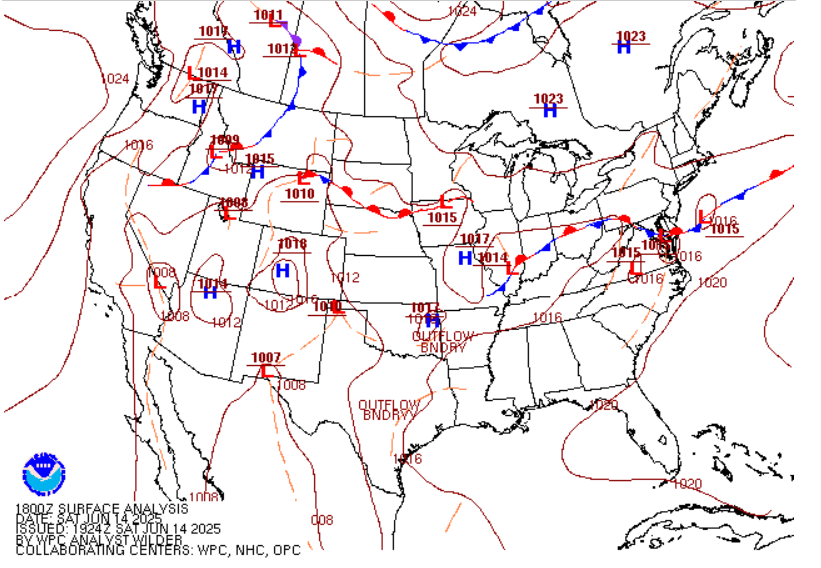
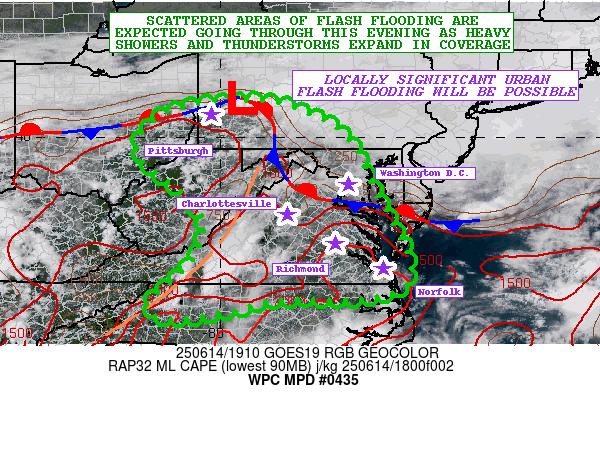
Heading into the weekend, the flash flood and storm threat shifted farther to the north and east. NWS WPC Surface Analysis at 1800 UTC 14 June 2025 showed a stalled front stretching from the Upper Ohio Valley to the Mid-Atlantic Coast. An MPD was issued at 1940 UTC 14 June 2025 noting ‘Flash flooding likely” with “a quasi-stationary front”.
The newly available Day Cloud Microphysics RGB on CIRA Slider uses the Visible Band 2 and Snow/Ice Band 5 at 1.6 um, similar to the Day Cloud Phase Distinction RGB, but uses the Cloud Particle Size Band 6 at 2.2 um instead of the Clean IR Band 13 to account for cloud particle size. In an animation of the RGB from ~1800 UTC 14 June to ~0000 UTC 15 June 2025, you can see several features, including a sea-breeze boundary across Delmarva with pink-purple colors depicting thick water clouds, and intense convection, first firing across southern Virginia before also firing in West Virginia, noted by clouds with small ice particles in the light blue colors. Day Cloud Microphysics RGB configurations are available in AWIPS, and can be shared upon request.
Figure 12: Day Cloud Microphysics RGB imagery from ~1800 UTC 14 June to ~0000 UTC 15 June 2025. From CIRA Slider
In the GOES-East Mesoscale IR imagery from ~2000 UTC 14 June to ~0500 UTC 15 June 2025, you will notice a cell blow-up in extreme northern West Virginia, near Wheeling, around the intersection of the WV, OH, and PA borders. A Flash Flood Warning was issued by the Pittsburgh WFO at 1206 UTC 15 June, and a Flash Flood Emergency was issued at 0407 UTC. The flash flooding resulted in seven deaths in Ohio County, WV.
Figure 12: Day Cloud Microphysics RGB imagery from ~1800 UTC 14 June to ~0000 UTC 15 June 2025. From CIRA Slider


