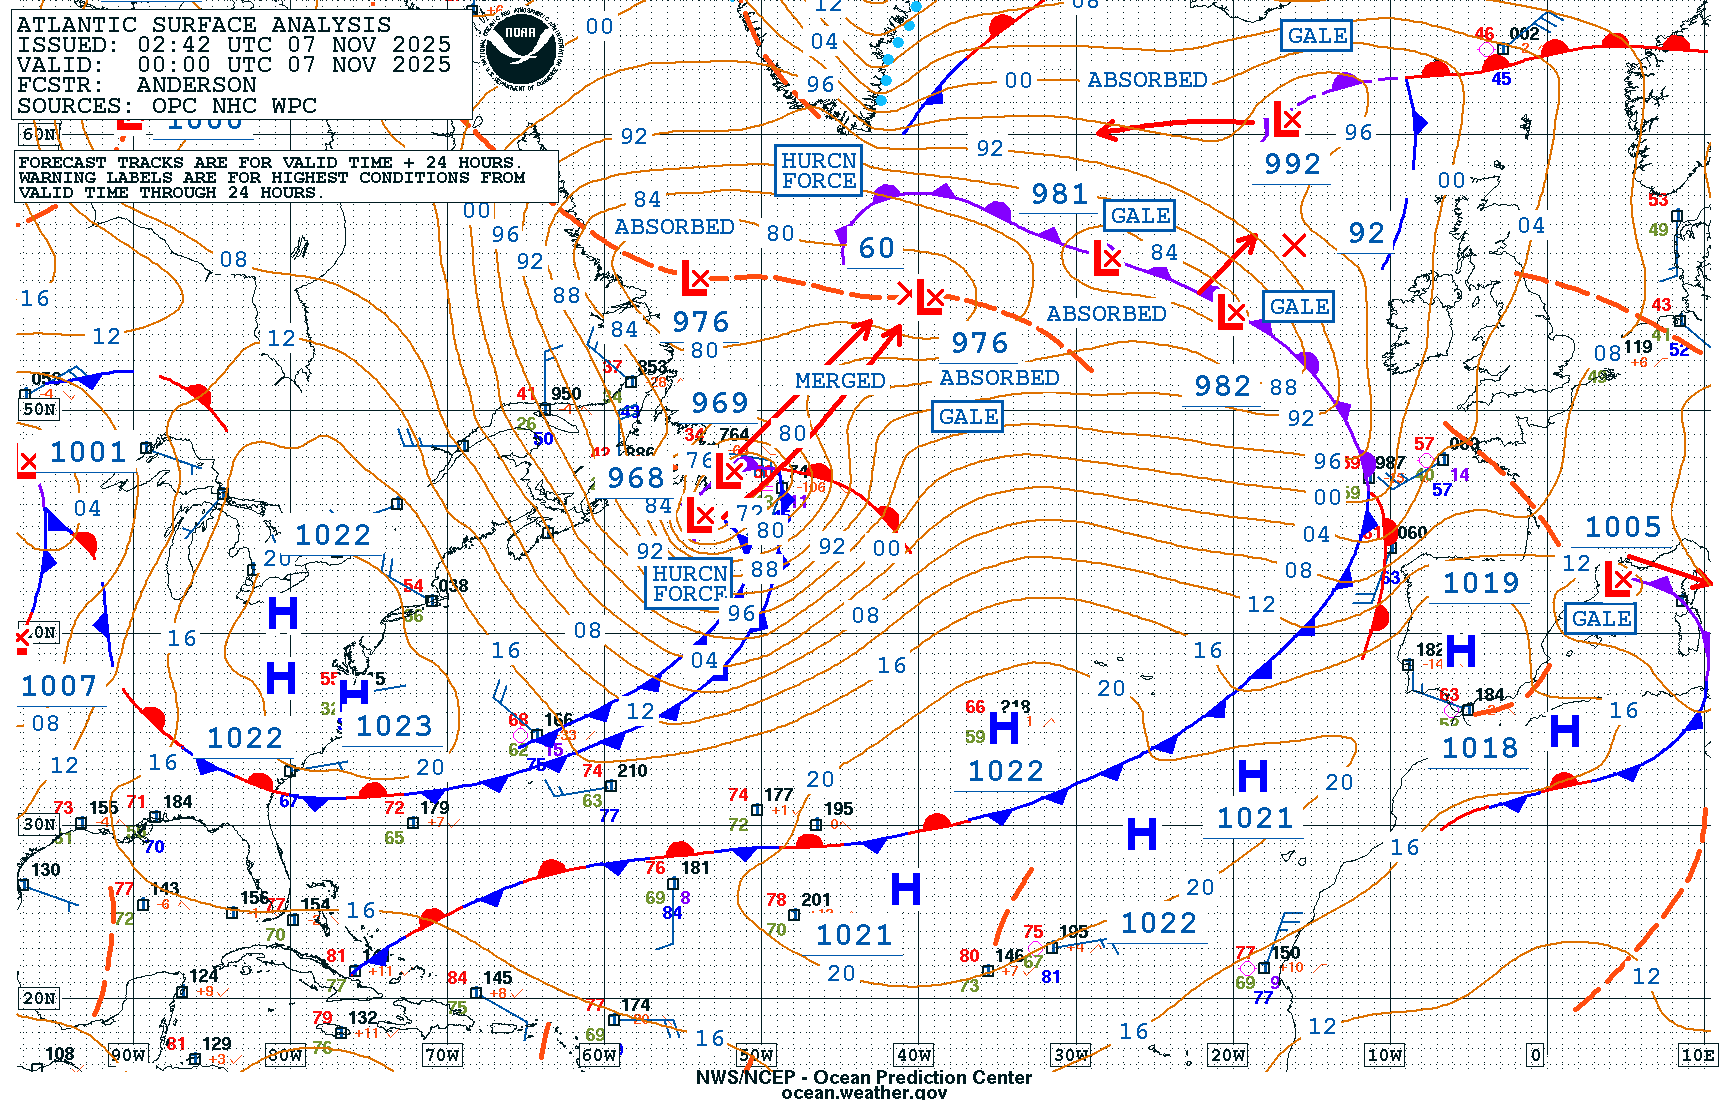
An explosive hurricane-force low traversed the northwestern Atlantic last week as the basin heads toward peak activity. November marks a transition month in extratropical hurricane-force low activity as the calmer Summer and early Fall are replaced by the active Winter storm track. Last week was no different, showcasing the large amount of baroclinic energy that is becoming readily available as colder air masses push across the relatively warm ocean waters. The NWS Ocean Prediction Center (OPC) highlighted the threat for a powerful low pressure system out to 96 hours in advance, forecasting a developing hurricane-force low by 1200 UTC 04 November 2025.

The system originated just offshore the North Carolina Coast, forming along the Gulf Stream, before tracking northeastward. The low pressure system experienced an incredible rate of rapid intensification, with the minimum central pressure dropping 61 mb in 24 hours, from 1005 hPa at 0000 UTC 04 November to 944 hPa at 0000 UTC 05 November 2025. This rate of deepening at the mid-point latitude of the extratropical cyclone’s path, around 43 degrees North, is equivalent to about 3.2 Bergeron, where a value of 1.0 Bergeron usually corresponds to a ‘bomb’ cyclone. According to NWS Weather Prediction Center (WPC) Meteorologist David Roth, all-time November low pressure records were shattered across Newfoundland by at least 15 hPa!
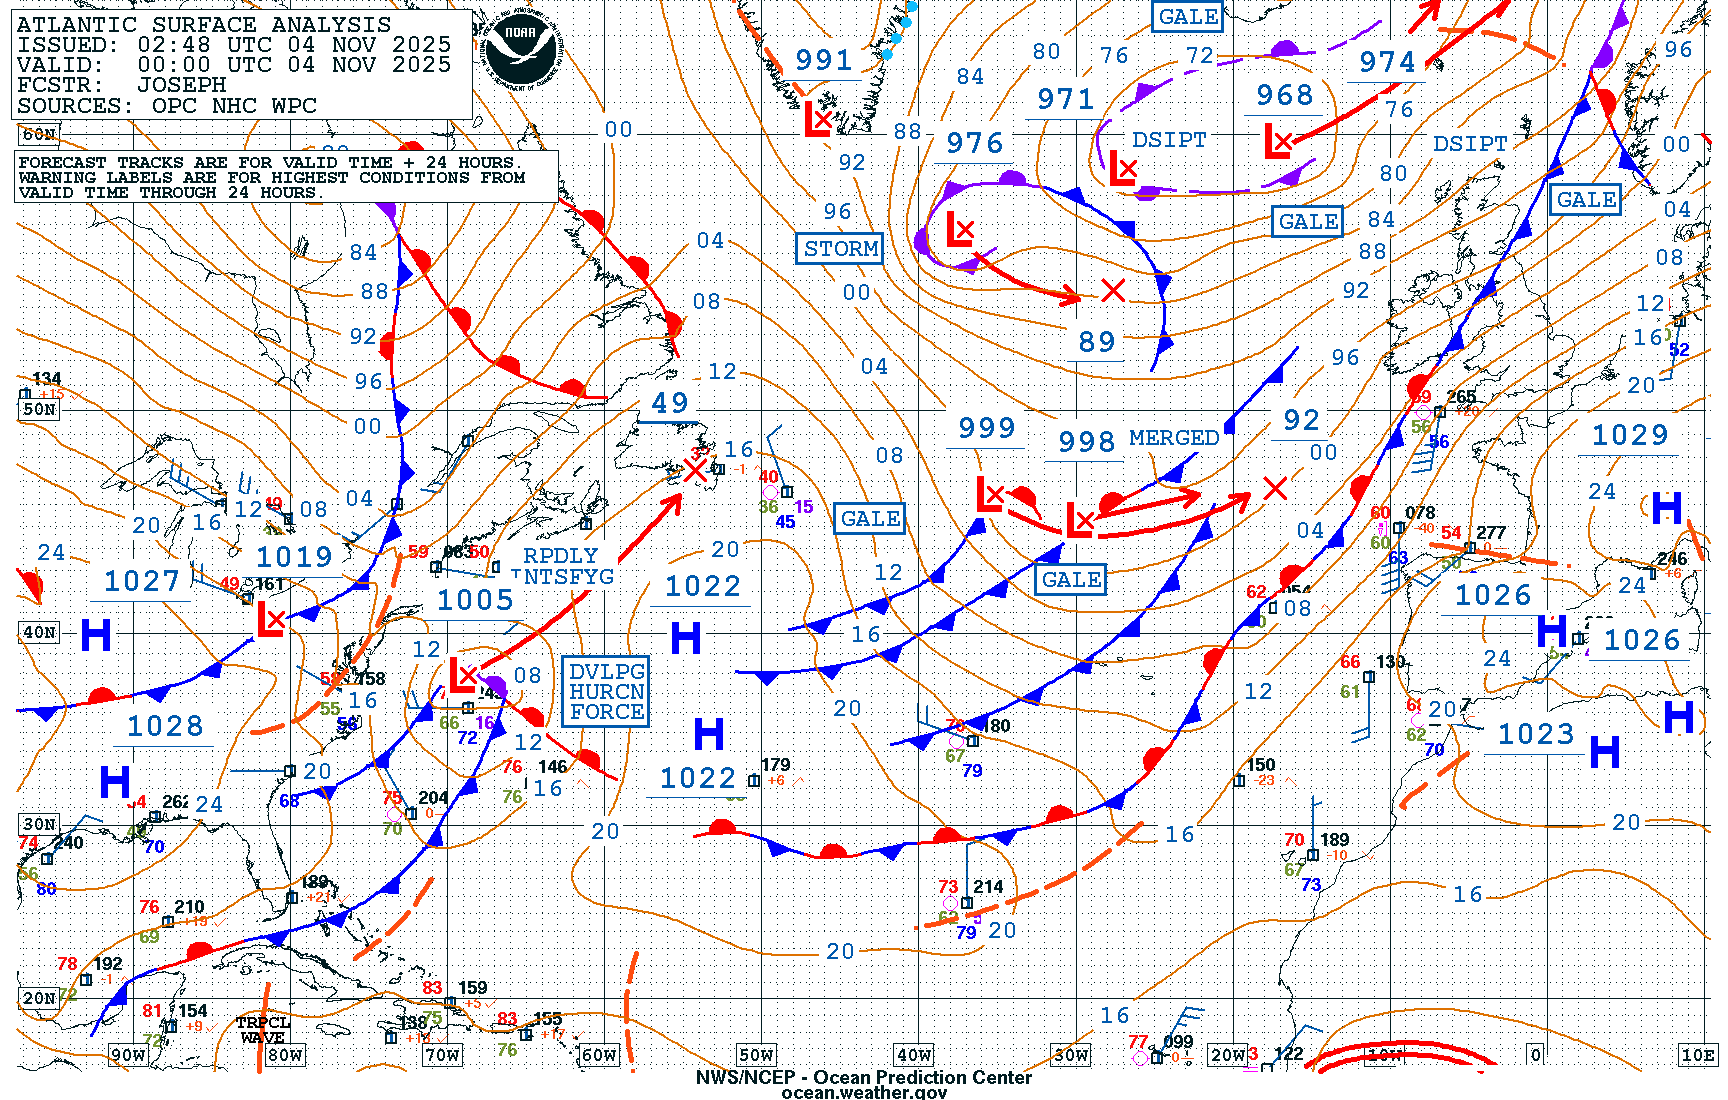
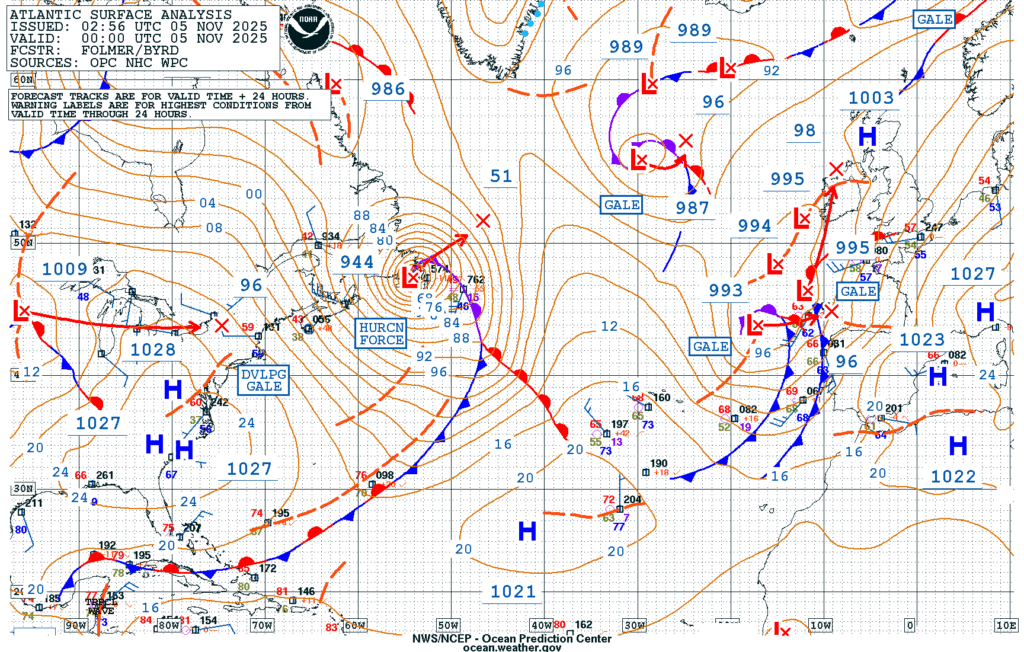
Figure 2: NWS OPC Atlantic Surface Analysis valid at 0000 UTC 04 November (left) and 0000 UTC 05 November 2025 (right).
GOES-East Full Disk AirMass RGB imagery provided a look at the evolution of the rapidly intensifying system. An upstream disturbance can be seen diving off the coast of New England and quickly becoming entrained, enhancing the amount of potential vorticity available to yield strengthening.
Figure 3: GOES-East AirMass RGB imagery from 0600 to 2350 UTC 04 November 2025. Credit: NESDIS/STAR
GOES-East Geocolor imagery overlaid with the GLM Flash Extrent Density also showed the rapid intensification, with even a brief period of lightning occurring along the bent-back front from ~1200 to ~1500 UTC 04 November 2025. By the end of the animation, the well-defined occlusion and tight circulation can easily be identified.
Figure 4: GOES-East Geocolor imagery overlaid with GLM FED from 0601 to 2351 UTC 04 November 2025. Credit: NESDIS/STAR
2025. Credit: NESDIS/STAR
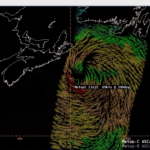
A Metop-C ASCAT pass went directly overhead low around ~1300 UTC, confirming winds in excess of 64 knots shortly after the system became hurricane-force at 1200 UTC 04 November 2025. West-to-northwest winds up to 65 knots can be seen in the southwestern quadrant, which is where the strongest winds are usually located in extratropical cyclones.

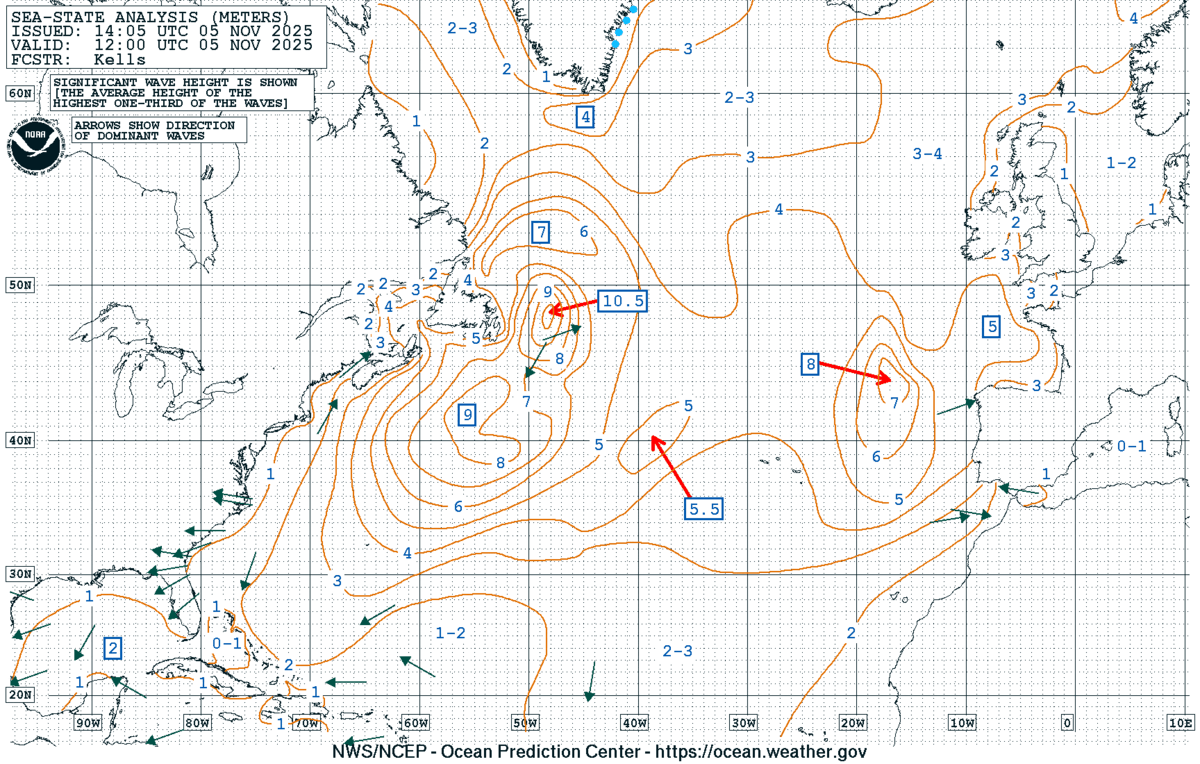
By 0000 UTC 05 November, the hurricane-force low was centered across southern Newfoundland. Just a couple of hours later as the system was starting to pull away, extremely large waves were still being observed in offshore waters. Two altimeter passes; one from Jason-3 and another from Sentinel-6A, were available just after 0230 UTC 05 November 2025, with both observing wave heights in excess of 30 feet, or up to 10 meters! The NWS OPC Sea State Analysis, which is in meters, had significant wave heights (the average height of the highest one-third of the waves) up to 10.5 meters at 1200 UTC 05 November 2025.

A RADARSAT Constellation Mission-1 (RCM-1) Synthetic Aperture Radar (SAR) Winds Pass at ~0910 UTC to the east of the low pressure circulation provided a high-spatial resolution view of intense winds just north of the occluded front, as winds shifted direction from the south to the southeast in excess of 50 knots. In addition to being provided by NESDIS/STAR, SAR winds are also available in AWIPS and soon to be implemented at NWS OPC.

With no rest for the weary, a separate hurricane-force low tracked right across Newfoundland only 48 hours later on 07 November 2025.
