")
Headlines
- Weak La Nina continues to affect tropical belt rainfall pattern mainly from Indian Ocean to central Pacific
- E. Pac. tropical cyclones cause flooding in Mexico and southwest U.S.
- Hurricane Melissa creates havoc and extreme rainfall across southern Haiti, southeast Cuba and especially in western Jamaica
This October the southwest Asian monsoon begins its retreat to the south as usual and the Atlantic and eastern Pacific tropical cyclone season erupts with destructive force over land, including very heavy rainfall, floods and landslides. La Nina is still weakly in force, affecting rainfall patterns in the tropical Pacific, with weaker connections elsewhere.
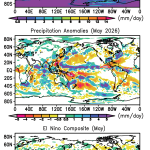
The Nino 3.4 ENSO SST index in the central Pacific stayed about the same this October (-0.5K (and -0.8K for the Relative 3.4 index), still indicating a weak La Nina situation. Figure 1 shows the precipitation map for this October (top panel) with the Asian monsoon rainfall slipping to the south a bit, active ITCZs in the major tropical oceans, and strong mid-latitude maxima in the N.H. compared to a weaker, but more continuous mid-latitude precipitation feature in the S.H.
The middle panel of Fig. 1 presents the anomaly pattern from climatology for this month’s precipitation. That pattern can be compared to the bottom panel, which is a composite La Nina anomaly map based on an average of Octobers with La Nina conditions. The two bottom panels have some similarities, especially along the Equatorial zone from the eastern Indian ocean across most of the Pacific. In the La Nina composite, a core negative anomaly at about 160°E along the Equator corresponds to the intense negative feature in the same spot in the anomaly map for this October. Over the Maritime Continent (MC) the composite has a broad positive feature with the largest values in the image. The anomaly map for this individual October has a weaker, more diffuse, but positive feature over the same area. These two features for this month solidify the connection to the La Nina state. However, while the La Nina composite has Australia covered with positive, wet anomalies (even though this is not the rainy season there), the map there for this month shows mostly neutral conditions.
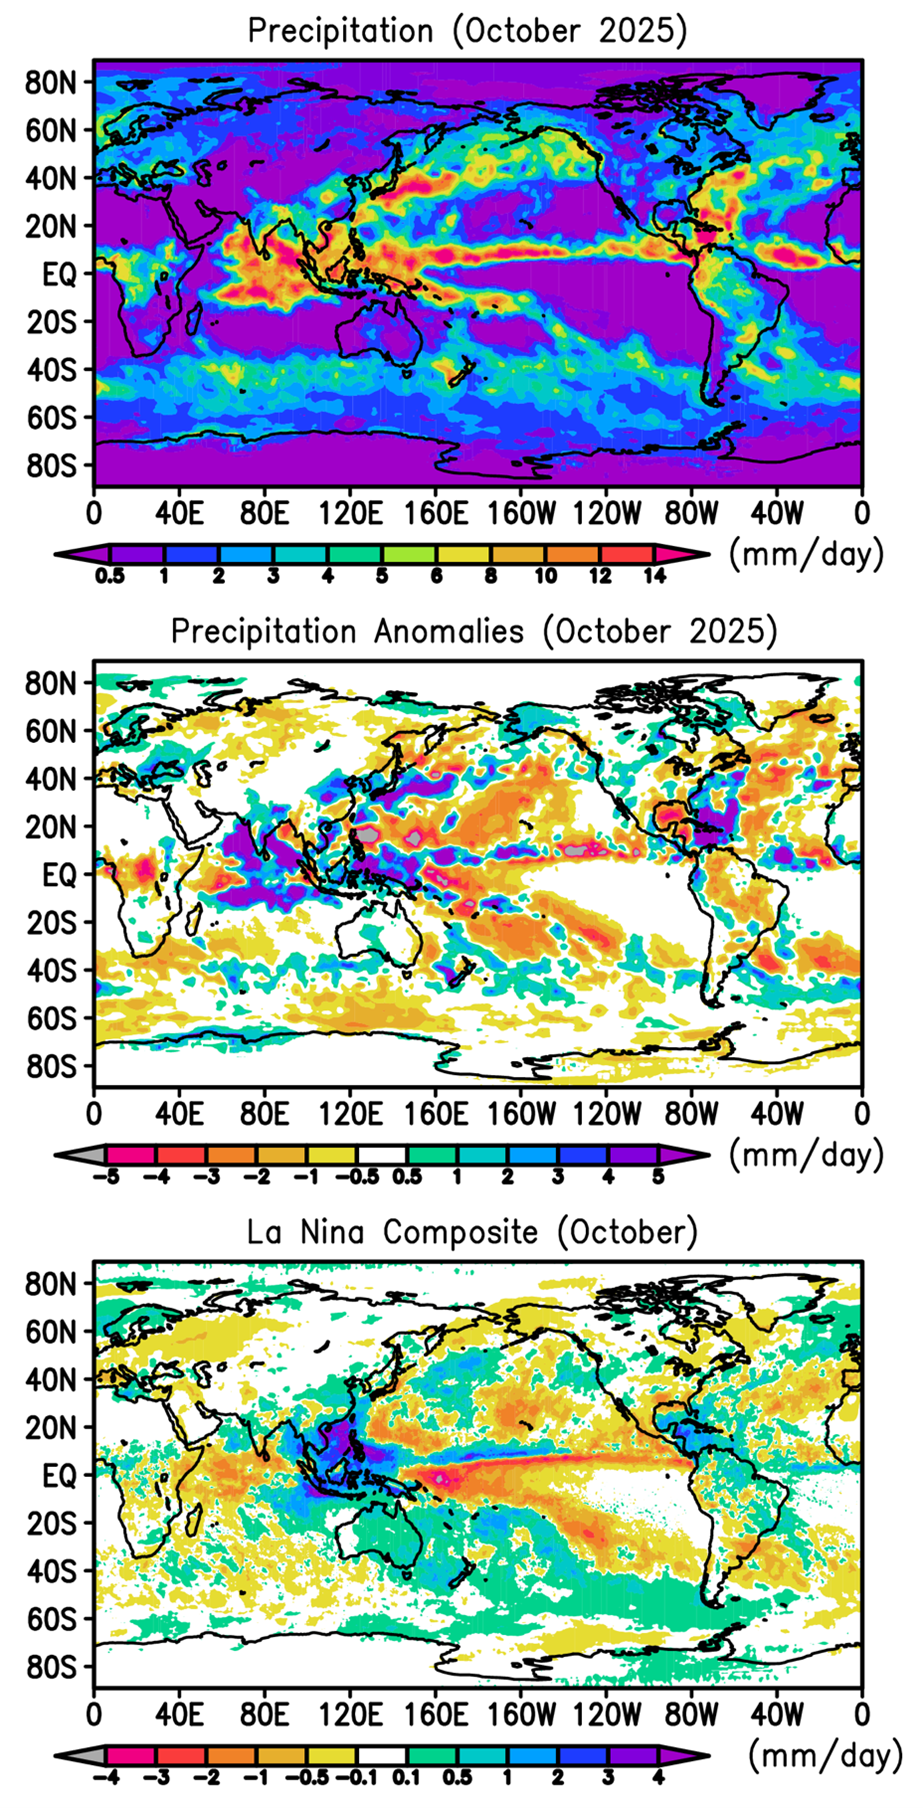
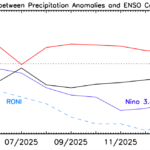
Across the tropical Pacific toward the east the patterns in the two figures seemed to be somewhat correlated. But, over other areas, for example over both North and South America, the patterns do not seem to be correlated. The pattern correlation between the two maps is +.27 for this month, the same as the last few months, but lower than the ~ +0.4 of last Dec.-Feb. when the Nino 3.4 Index got down to -0.7K. Figure 2 shows the last year of Nino 3.4 and the pattern correlations. There is a 1-2 month lag, with the rainfall pattern correlation lagging the shift in SST.

October is a prime month for tropical cyclones across the N.H. and they affected various locations in various ways this month. East Pacific tropical cyclones tend to generate just west of Central America and often move quietly out to sea to the west. A few slip up the west coast of Mexico coming ashore with wind damage and heavy rain and flooding. And that was the case this October with a trio of storms (TCs Octave, Priscilla and Raymond). After damaging western Mexico coastal regions, they produced a positive rainfall anomaly for the month in northwest Mexico, which also seems to appear as a small feature in the La Nina composite (coincidence?).
But these storms, and their tight time sequence early in the month, also produced copious moisture available for other weaker dynamic systems and orographic lifting. The result was heavy rain across parts of the southwest U.S. and some flooding, including in southwest Colorado where rivers coming out of the San Juan Mountains were supplied with rain from the moisture and orographic uplift, including Villecito Creek, flowing out of the south side of the Weminuche Wilderness hit a record streamflow. Even worse, the abundant moisture also affected central and eastern Mexico where remnants of the storms’ circulations caused landslides and flooding after 24” of rain over three days and left 60 dead.
And near the end of the month a weak cyclonic system developed in the Caribbean, slowly became a Hurricane Melissa south of Jamaica and then suddenly intensified to a Category 5 storm, already delivering heavy rain to southwest Haiti, but then moved north and came ashore in western Jamaica causing destruction due to winds and storm surge and flooding with estimated rainfall of ~500 mm (from NASA IMERG satellite estimates). It then continued north over eastern Cuba and into the Atlantic. Total deaths reported at 60. The purple blob in Fig. 1 (middle panel) in that region is largely due to Melissa. That blob seems to have a weaker counterpart in the La Nina composite map.
And then, at the very end of the month a weak cyclonic system hit central Vietnam with estimated rain at 600 mm and severe flooding and 30 more dead.
Continuing the comparison of this month’s anomaly map with the La Nina composite, one can see the positive correlation between the two in the sub-tropics of the Pacific and Atlantic and most of the Indian Ocean. North America also shows similarities, except for Alaska. However, neither Africa nor South America show a link between the two maps.
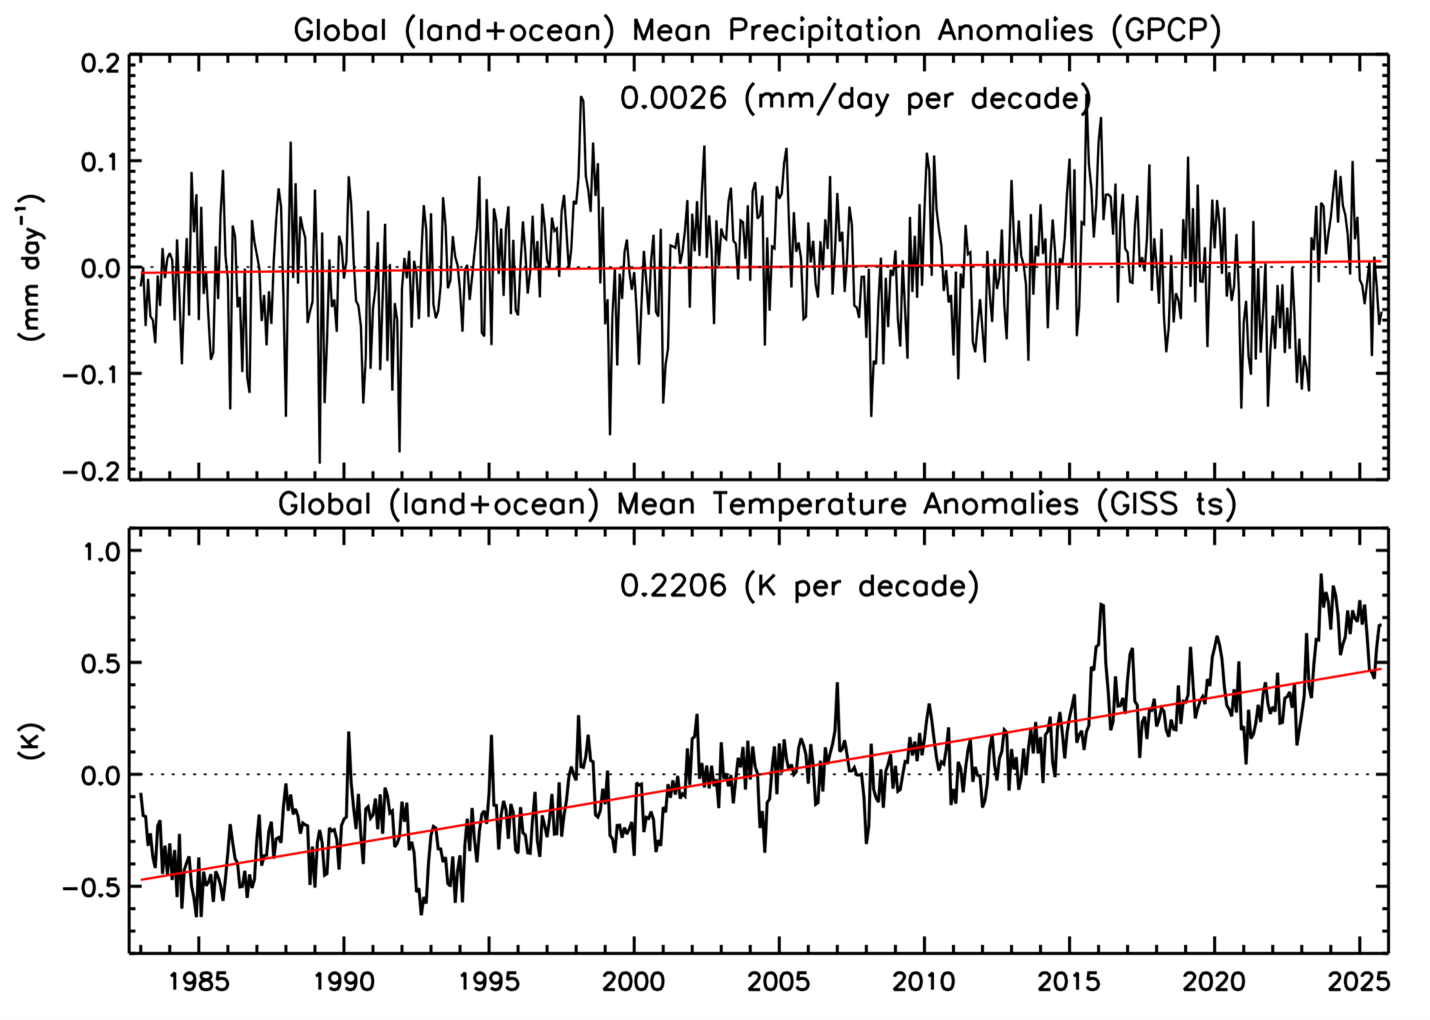
The global rainfall and surface temperature records from 1983 to the present (Fig. 3) show global variations related to ENSO in both curves relative to the trends (near zero trend in global precipitation). El Nino’s tend to have periods above the trend lines, La Nina periods below the trend lines. The El Nino centered on 2024 show this type of feature, but the weak La Nina of 2025 has that type of feature on the precipitation curve (below the trend or mean), while the surface temperature has for most part remained above the trend line. Is this something new in the condition of the planet’s temperature, or is this La Nina just too weak. Maybe we will see if something new evolves over the coming months.
Global Precipitation Climatology Project (GPCP)
This global precipitation summary is based on V3.2 of the Monthly Global Precipitation Climatology Project (GPCP), an observation based analysis using satellite observations over oceans and satellite and rain gauge observations over land. The Monthly analysis extends from 1983-Near Present as a Climate Data Record (CDR) with an extension to the previous month (within ~ 12 days of the end of the month) as an Interim CDR, or ICDR.
The following references describe GPCP in detail and provide additional results by the authors of this summary:
Huffman, G. J. and R. Adler, A. Behrangi, D. Bolvin, E. Nelkin, G.Gu and M. Ehsani, 2023. The New Version 3.2 Global Precipitation Climatology Project (GPCP) Monthly and Daily Precipitation Products. J. Climate, 36, 7635- 7655. DOI: 10.1175/JCLI-D-23-0123.1.
Adler, R., G. Gu, M. Sapiano, J. Wang, G. Huffman 2017. Global Precipitation: Means, Variations and Trends During the Satellite Era (1979-2014). Surveys in Geophysics 38: 679-699, doi:10.1007/s10712-017-9416-4
Adler, R., M. Sapiano, G. Huffman, J. Wang, G. Gu, D. Bolvin, L. Chiu, U. Schneider, A. Becker, E. Nelkin, P. Xie, R. Ferraro, D. Shin, 2018. The Global Precipitation Climatology Project (GPCP) Monthly Analysis (New Version 2.3) and a Review of 2017 Global Precipitation. Atmosphere. 9(4), 138; doi:10.3390/atmos9040138
Adler, R. F., G. Gu, G. J. Huffman, R. P. Sapiano and J. Wang, 2020: GPCP and the Global Characteristics of Precipitation. In Satellite Precipitation Measurement, Vol. 2, Chapter 35, 677-697. Advances in Global Change Research, 69, Springer Nature, doi:10.1007/978-3-030-35798-6_11.
Gu, G., and R. Adler, 2023. Observed Variability and Trends in Global Precipitation During 1979-2020. Climate Dynamics, 61, 131-150.
Adler, R. and G. Gu, 2024. Global Precipitation for the Year 2023 and How It Relates to Longer Term Variations and Trends. Atmosphere, 15(5). 10.3390/atmos15050535.
Gu, G. and R. Adler, 2024. Variability and Trends in Tropical Precipitation Intensity in Observations and Climate Models. Climate Dynamics, https://doi.org/10.1007/s00382-024-07287-y.