Headlines
- The La Nina weakened in April in terms of the global rainfall anomaly pattern
- A double ITCZ is visible across the entire Pacific with variations in intensity, related in part to the La Nina
- North America had flooding in the center, but relatively dry conditions in the west and the east and way below normal end-of-season snowpack in the southern Rockies
- The global land-ocean precipitation split shows a record-setting La Nina-type scheme of land high and the ocean low, even as the global surface temperature remains high, even relative to the long-term trend
The global map of precipitation for this April from the GPCP analysis (Fig. 1, top panel) has a distinct double ITCZ across the entire Pacific Ocean, with various regional intensity levels of monthly rainfall. With the sun roughly above the Equator at this time of year this feature might reflect what would occur on an ocean planet with a vertical axis of rotation, with rainfall bands on both sides of the Equator and a dry feature right on the Equator. But there are also anomalies relative to climatology as seen in the middle panel of Fig. 1, with the strongest feature being the rain deficit in mid-Pacific along the northern band of the two-pronged ITCZ. Here this continuing negative feature clearly is associated with the continuing La Nina of the last six months or so (see the La Nina composite for the month of April in the bottom panel of Fig. 1).
Along the northern branch of the ITCZ to the east there is an abundance of rain over warming coastal waters near the South American coast, heavy rain over northernmost South America and a strong Atlantic ITCZ (single band). The Pacific ITCZ band south of the Equator is relatively weak in the eastern Pacific, but strong with positive anomalies in the western Pacific, with very heavy rainfall over the island of New Guinea. That positive anomaly also extends to the west over Borneo and Sumatra and to the south over eastern Australia, all of which is also La Nina-like. Across the Indian Ocean a rainfall deficit dominates with Africa having mainly a deficit above the Equator and the Horn of Africa and a rainfall surplus to the south—all of which are similar to the La Nina composite for April.
In terms of Pacific Ocean water most of the relatively cold water associated with the La Nina has nearly disappeared, especially at depth, although at the surface the Nino3.4 Index was -0.2C for April, just slightly on the La Nina side, and the Relative Nino3.4 Index is colder at -0.6C. So the cold surface waters are still negatively affecting the water vapor and the convection/rainfall in a relative sense as seen in the discussion above.
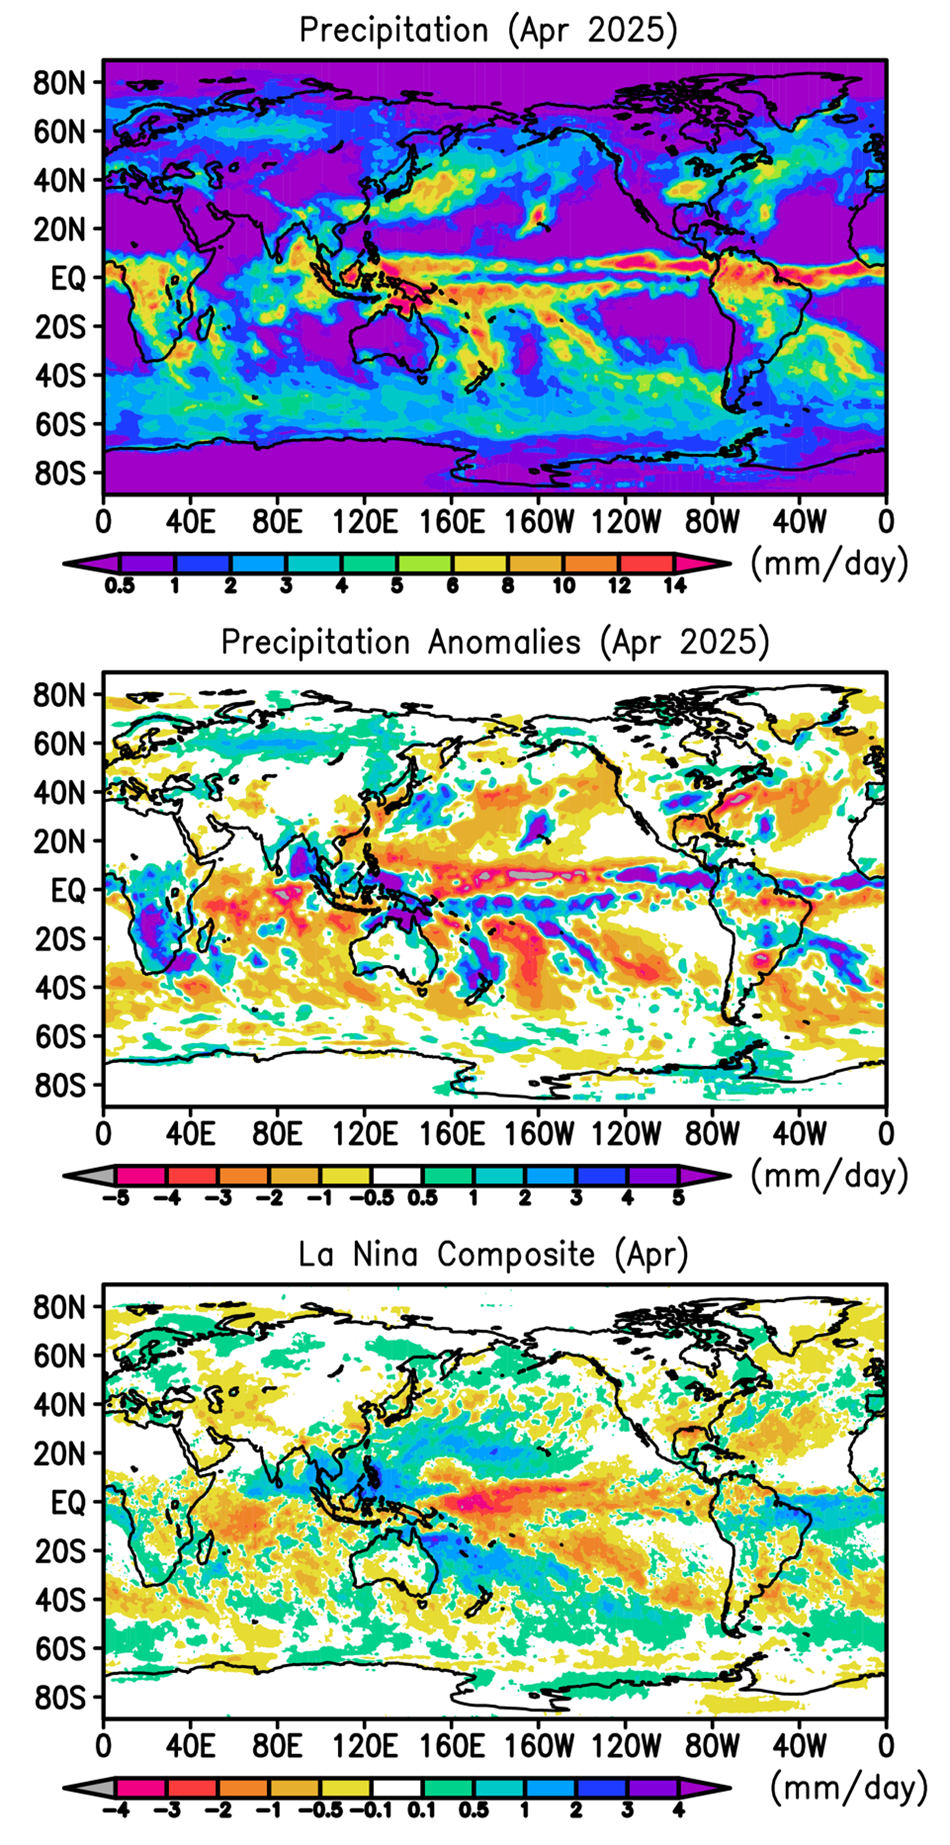
In Europe a drought continues from France and the U.K. eastward, with numerous wildfires reported in the U.K. The Iberian peninsula remains wetter than normal.
North America, Mexico and the southwest U.S. mostly continue dry, but the midsection of the U.S. suffered very heavy rain, severe thunderstorms and significant flooding. The snowpack in the southern half of Colorado at the end of April was less than 40% of normal, pointing to water resource problems for the Colorado and Rio Grande Rivers in the coming months. Along the east coast drought conditions were evident from Florida to New England in April with wildfires in various places, including southern New Jersey.
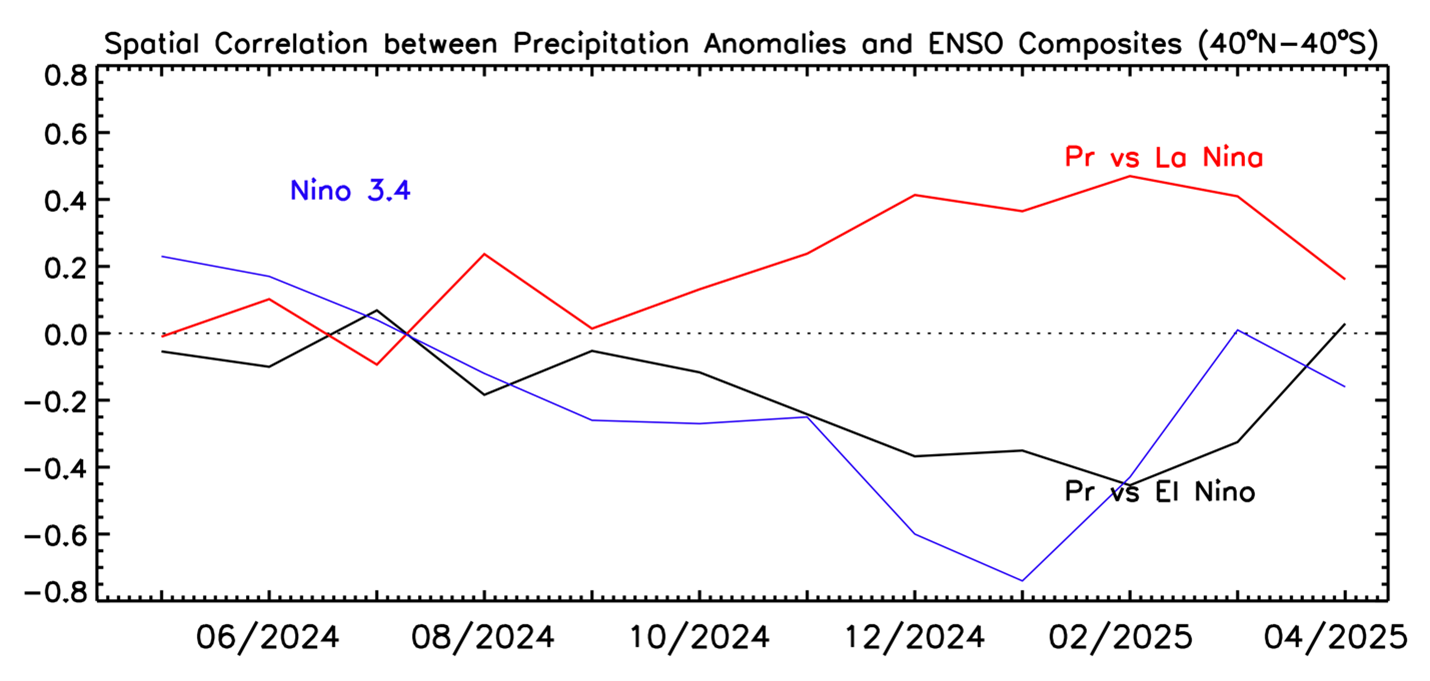
While the rainfall anomaly pattern across Indian Ocean through most of the tropical Pacific is still similar to the La Nina April composite map, which is based on previous April La Ninas, beyond this central region the La Nina connection becomes more vague. Figure 2 shows that the La Nina pattern correlation over the tropics has dropped sharply this month signaling the final throes of this ocean/atmosphere phenomenon often affecting rainfall across the globe.
But something else may be happening this April associated with the La Nina. La Ninas are known for relative precipitation minima over ocean and relative maxima over land, mostly based on how the vertical motion anomalies are located relative to the land masses. One can even get a sense that the anomaly pattern in Fig. 1 (middle panel) seems to have a lot of dry areas over the ocean in general this month. Figure 3 shows every April globally over the past 40 years and April 2025 turs out to be record setting with the highest April land precipitation value and the lowest April ocean precipitation value, with the ocean+land total also a record-setting low. We are checking these numbers, but it might be a “last gasp” of this La Nina. And the month-to-month global numbers (Fig. 4) show the large drop in global precipitation anomaly from the previous month—the La Nina finally going globally negatively—also see Table 1. The global surface temperature remains high (even relative to the trend line) despite the plunge in global precipitation number. It will be interesting to see the evolution of these numbers as we likely move toward neutral ENSO conditions.
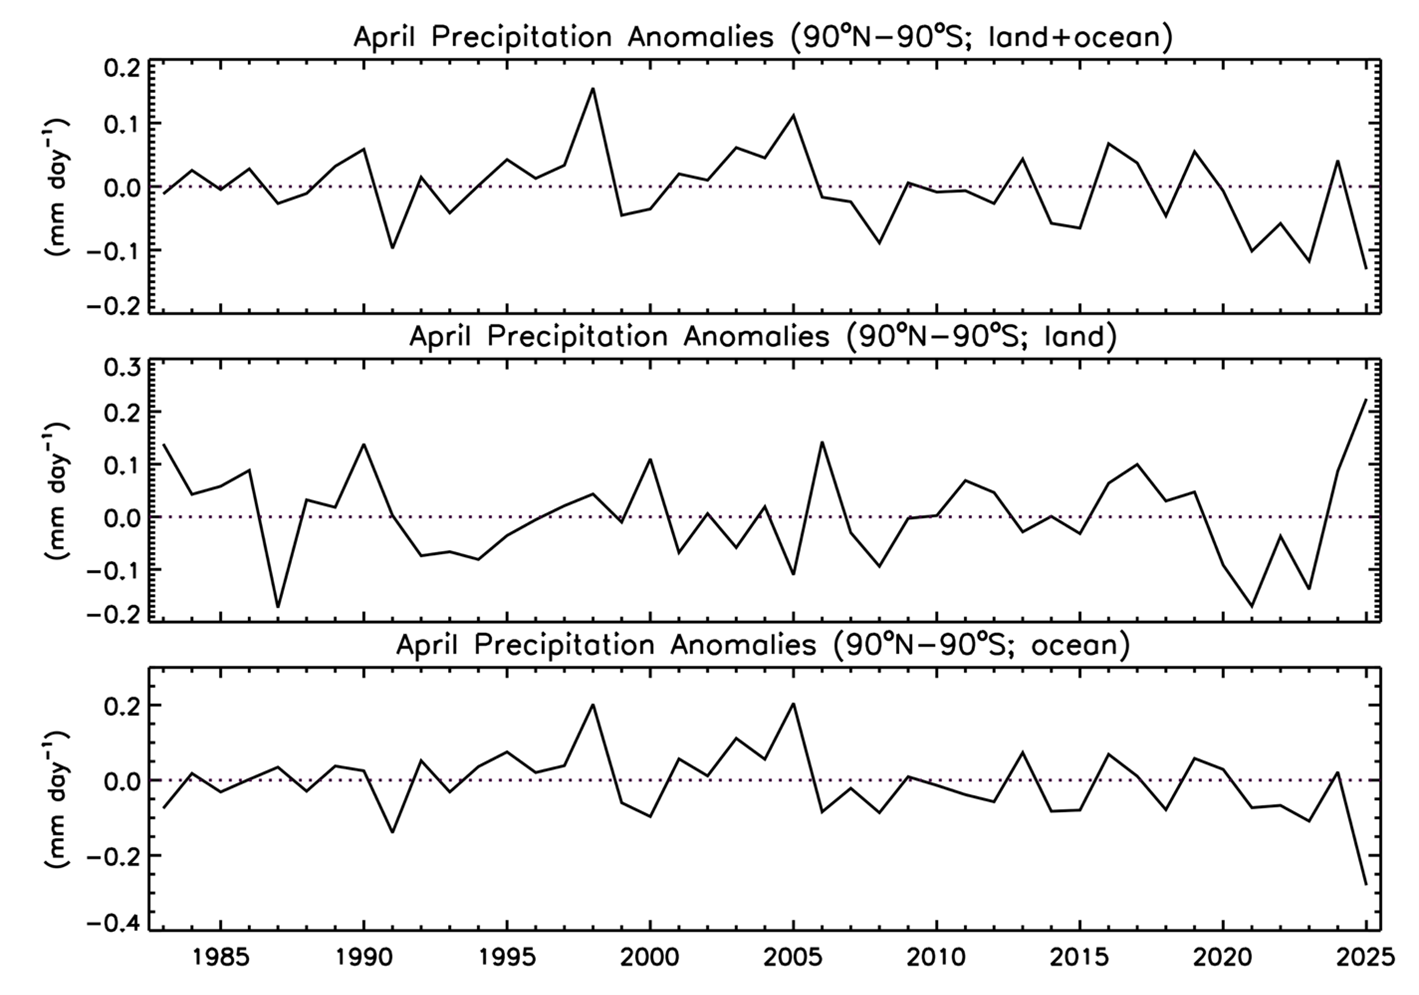
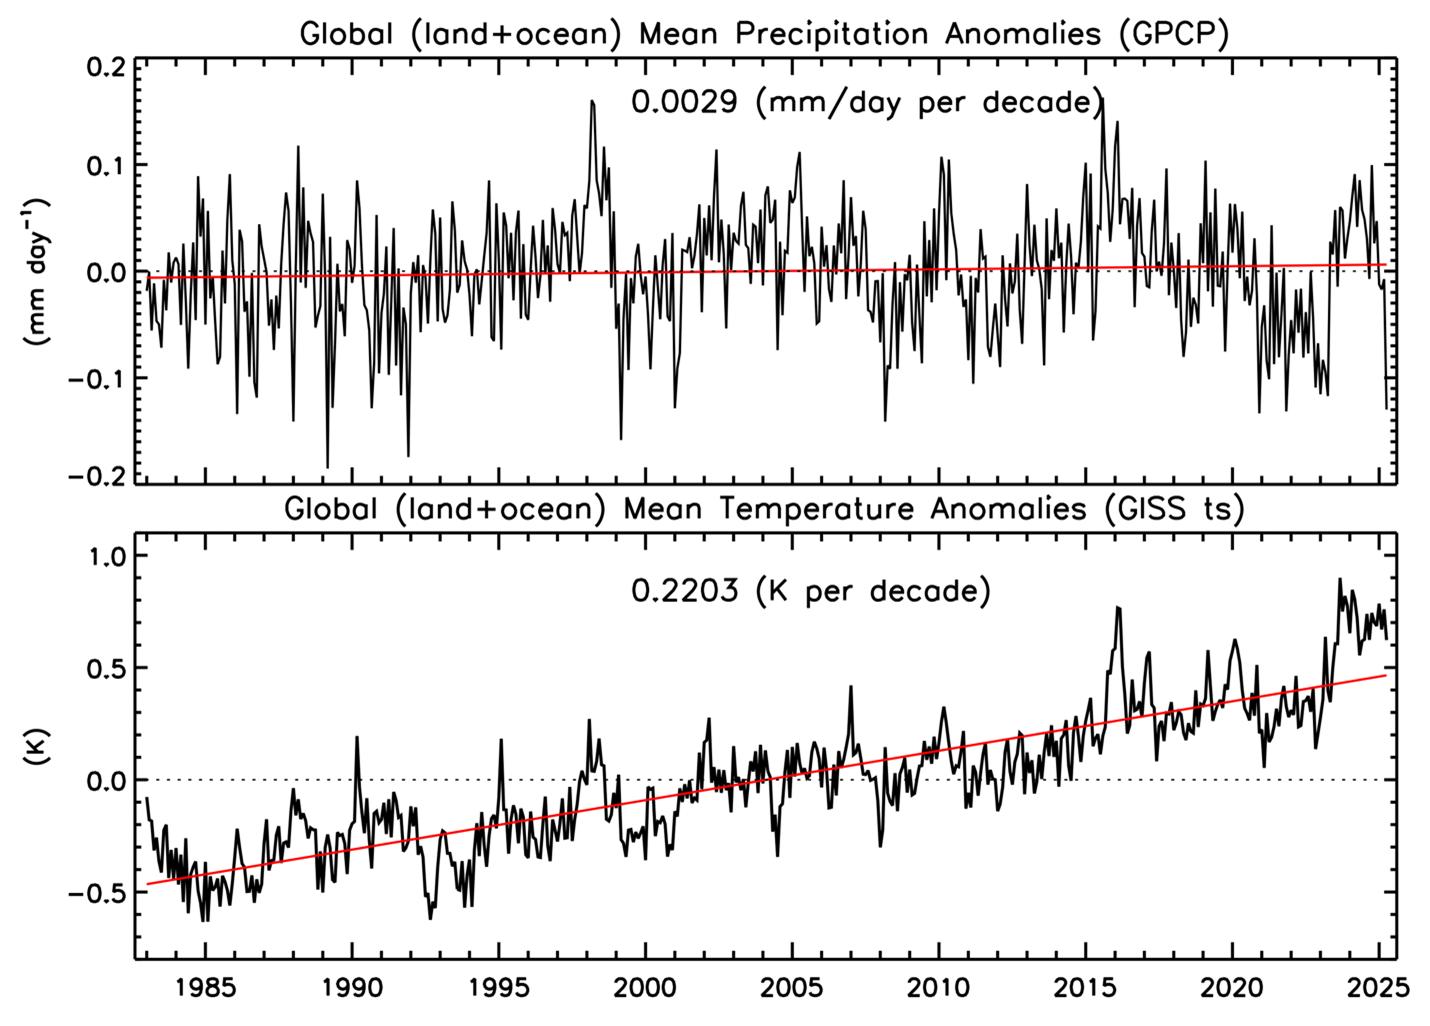
Table 1 Global precipitation and anomalies in April 2025.
| Mean Precipitation (April 1983-2024) | Precipitation (April 2025) | Precipitation anomaly (April 2025) |
Land+ocean | 2.76 | 2.63 | -0.13 |
Land | 2.06 | 2.28 | +0.22 |
Ocean | 3.05 | 2.77 | -0.28 |


