")
Headlines:
The La Nina rainfall anomaly pattern strengthens across tropics from Indian Ocean to Americas
Drought in southwest U.S. and Mexico with wildfires in California; northwest U.S. hit by sequence of Atmospheric Rivers (ARs)
Global mean temperature and precipitation remain above expected values for (weak) La Nina conditions
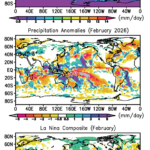
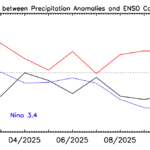
The Nino 3.4 SST index dropped steadily from November through December to -1.1C at the end of the month, indicating a strengthening, but not strong, La Nina. The precipitation anomaly pattern for December responded to that change with a strengthening of the La Nina features, at least across most of the Pacific and Indian Oceans and surrounding land areas—see Fig. 1. The intense negative rainfall anomaly at about 160°E along and just south of the Equator in the western Pacific has deepened, and has negative attachments extending eastward along the Equator and also southeastward along the eastern flank of the South Pacific Convergence Zone (SPCZ). These features are also generally noted in the La Nina composite for December (bottom panel), but not with similar shapes and intensities. Other dry anomaly blotches are evident in the sub-tropical North Pacific and connect to the dry area over the southwest U.S., also a typical feature of La Nina. There were even wildfires in southern California (even before the terrible fires in Los Angeles in January). There is a very narrow strip of positive anomalies this December across the Pacific, just above the Equator. In the west Pacific this feature is partially associated with leftover tropical cyclone tracks, but is only slightly suggested in the La Nina composite.
To the west along the Equator, there is a broad region of positive rain anomaly across the Maritime Continent, the Philippines, the South China Sea and the parts of the eastern Indian Ocean. Again this is typical of La Nina conditions at this time of year. Australia, usually wet for La Nina is more mixed for this December than in the composite. In fact, extreme heat and dry conditions helped provide conditions for fires requiring evacuations in western Victoria state, a situation not typical of general La Nina conditions.
The western half of the Indian Ocean, however shows fairly typical La Nina dry conditions extending into the Horn of Africa. But, there was also room for Cyclone Chido (Cat. 4) to traverse the south Indian Ocean and hit the island of Mayotte with devastating results, before also hitting the Mozambique coast. Chido’s rainfall track is evident as the east-west oriented positive anomaly (middle panel) to the north of Madagascar cutting through the normally La Nina dry area. The dry feature over eastern China this month also fits the La Nina model, along with its extension to the northeast across Japan and into the northwest Pacific Ocean. South America in general seems to only weakly fit the La Nina model, except in the northwest corner and over Central America. The tropical Atlantic Ocean is nearly opposite the La Nina composite.
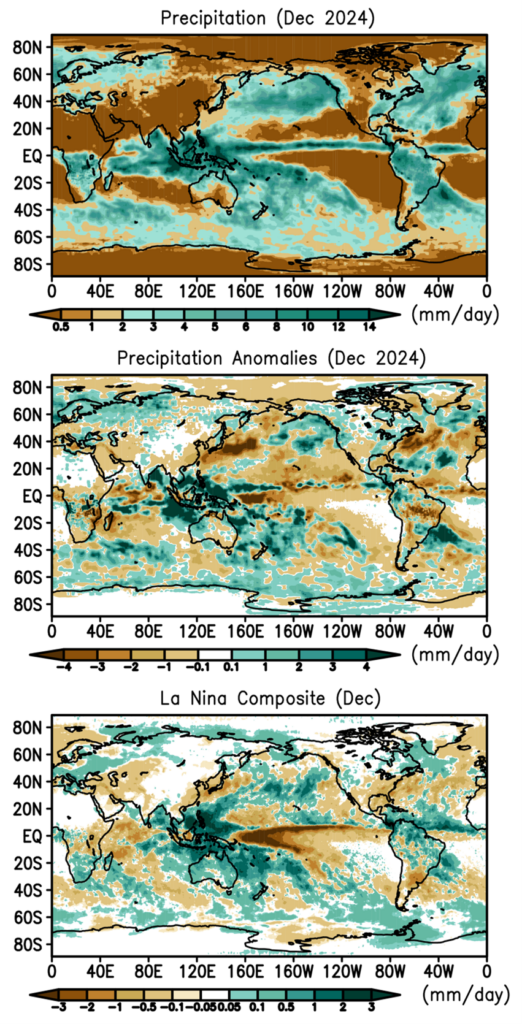
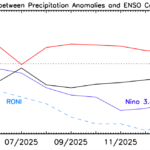
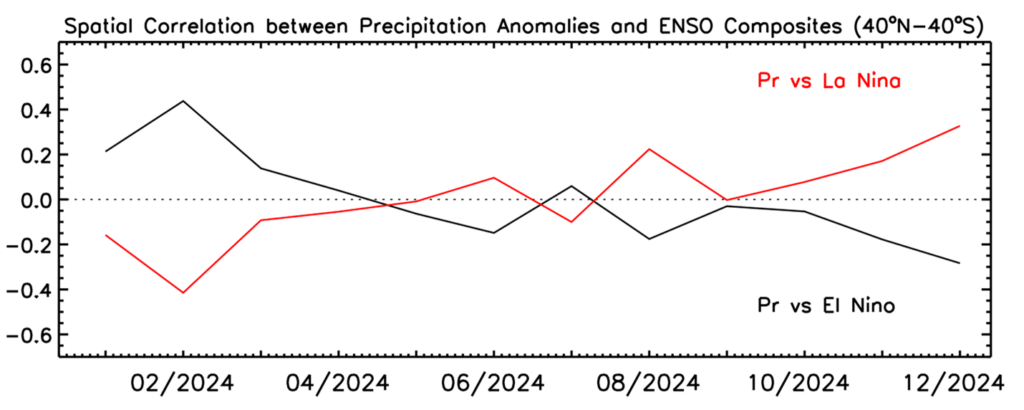
Figure 2 shows an updated spatial correlation plot between the last year’s monthly tropical anomaly maps and the El Nino and La Nina composites. The La Nina correlation for December 2024 has increased a bit from previous months, quantifying the intensifying effect of La Nina on the tropical pattern.
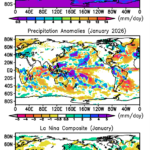
As stated before there is a broad area of negative anomaly across much of the sub-tropical Pacific—extending into the southwest U.S. and Mexico. However, over the northwest corner of the U.S. there is a positive precipitation anomaly associated with frequent Atmospheric River (AR) events, also evident in the La Nina composite.
Western Europe had generally dry conditions in December, but a warm Mediterranean Sea helped to fuel heavy rains over Greece and surrounding areas causing floods. A winter cyclone caused flooding at the end of the month in the U.K.
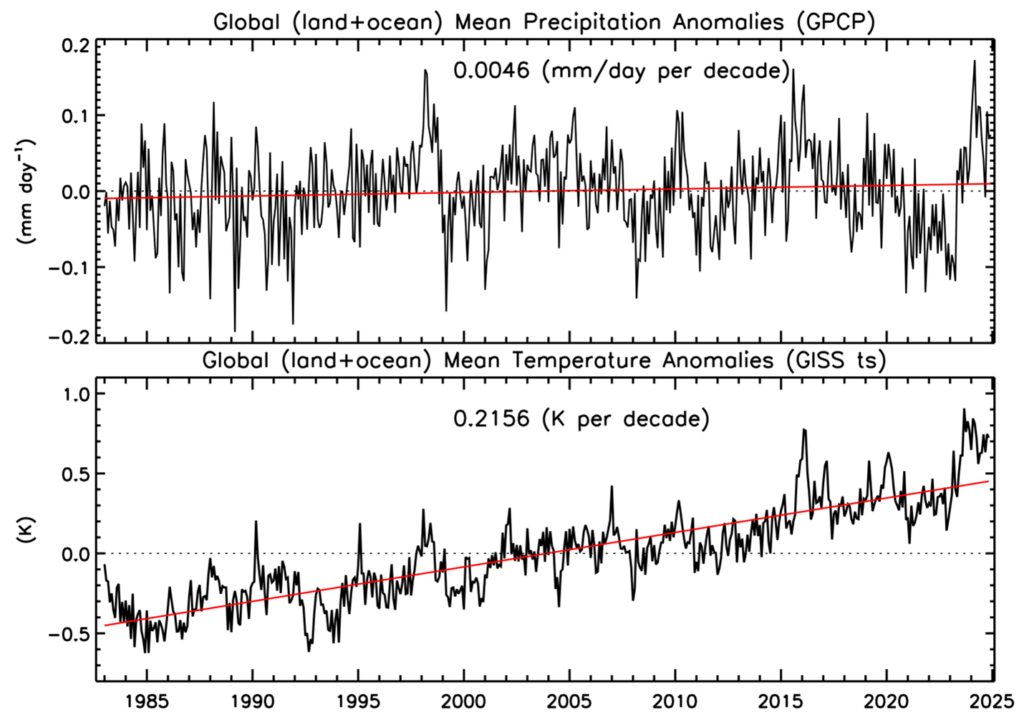
Figure 3 shows the global surface temperature and global precipitation anomalies back to 1983. The current weak La Nina is not affecting the global surface temperature that much, but also not affecting the global precipitation total either. Both numbers are above their long-term trends (or lack thereof when it comes to precipitation). Whereas the strong La Nina (2020-2022) had Ts and global precipitation below the surrounding values, this current weak La Nina has only slightly reduced temperature and precipitation values from brief El Nino (2023-2024). Are the inter-annual forces/effects being overwhelmed by the long-term/climate change processes?