")
Headlines:
The La Nina rainfall anomaly pattern from the Indian Ocean to the central Pacific remains strong
Extension of the alternating La Nina pattern across the subtropics to the southwest U.S. continued the drought there and helped to lead to the deadly fires in Los Angeles
Western Europe hit with a series of storms leading to heavy rain and flooding in the British Isles and the Iberian peninsula
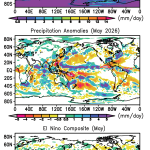
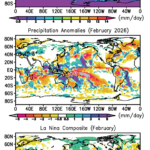
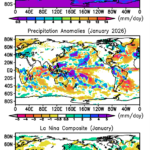
It’s a new year, but after a record warm 2024 in terms of global surface temperature, along with very high global precipitation (see note at the end of this report revisiting the 2024 global precipitation number), global SSTs remain generally high in January, but with a continuing La Nina SST pattern with a negative anomaly along the Equator in the central Pacific leading to a January Nino 3.4 Index of ~ -0.7C, indicating a continuation of the relatively weak La Nina condition. This cool SST feature is connected with a relatively weak ITCZ rainfall feature in the western-central Pacific (see Fig. 1), located a little north of its climatological position, with an intense negative rainfall anomaly (see Fig., middle panel) along the Equator from 140-180°E, with negative extensions to the southeast along the SPCZ and eastward parallel to the ITCZ. This negative rainfall feature along the Equator has been there for over six months during the La Nina. Further to the east, closer to the coast, the ITCZ shows positive anomalies. Comparison with the La Nina composite (Fig. 1, bottom panel) shows that this month’s pattern has the intense negative core, perhaps a little further to the west, but seemingly lacks a strong influence to the east and southeast.
West of the strong negative core feature, a variable, but generally positive, anomaly covers a similar-sized area over the Maritime Continent and the surrounding oceans with tendrils extending southeastward into the South Pacific, into the eastern Indican Ocean and northeastward into the North Pacific. This positive anomaly pattern matches well with the La Nina composite in the figure and was related to some high-end rainfall extremes and floods on the island of Java in Indonesia. To the south, however, Australia this month is mostly dry, unlike the composite result with evidence of positive anomalies along its east and west coasts. In fact, just after the month’s end, very heavy rain and flooding occurred in north Queensland along the coast in the first few days of February. A dry swath across eastern China into Japan has persisted over the last few months and roughly matches the composite.
Further to the west the Horn of Africa is dry, even for the dry season, while further south the continent is mostly wetter than normal, both features somewhat in agreement with the La Nina composite. Tropical cyclones were active in the South Indian Ocean in January, with TC Dikeledi tracking westward across the ocean, crossing the northern tip of Madagascar, glancing past the coast of Mozambique and then moving southeastward past Madagascar again into the open ocean. The precipitation track from Dikeledi is somewhat evident in the anomaly map for the month. Other weaker cyclones or precipitation features traversed the northwest and northeast coasts of Australia and show up distinctly in the anomaly map.
Over North America dry conditions dominate over the western and eastern thirds of the continent, with some small areas of surplus precipitation through the middle, east of the Rocky Mountains. Alaska was mostly warm and wet this January.
The continuing dry conditions in the southwest U.S. and northern Mexico extended the wildfire season there with the devastating and deadly fires in Los Angeles early in the month. Twenty-nine people died and entire neighborhoods were burned to the ground. Above average precipitation a year ago under El Nino conditions produced ample vegetation that then dried out and became fuel for the fires under the weak La Nina of the past six months. The longer-term trend toward dry conditions in this region under global warming also contributed to the dry situation. Although the northwest coast and associated mountains had precipitation during the month, it wasn’t until very late in the month that southern California finally had a small amount precipitation to help douse the wildfires and even cause some mudslides in fire-scorched zones. The dry zones over the western U.S can be seen as extensions from the eastern Pacific and connected to the dry-wet-dry alternating pattern starting at the strong La Nina dry anomaly back at ~ 0°N, 170°E.
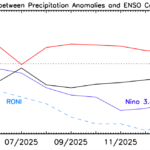
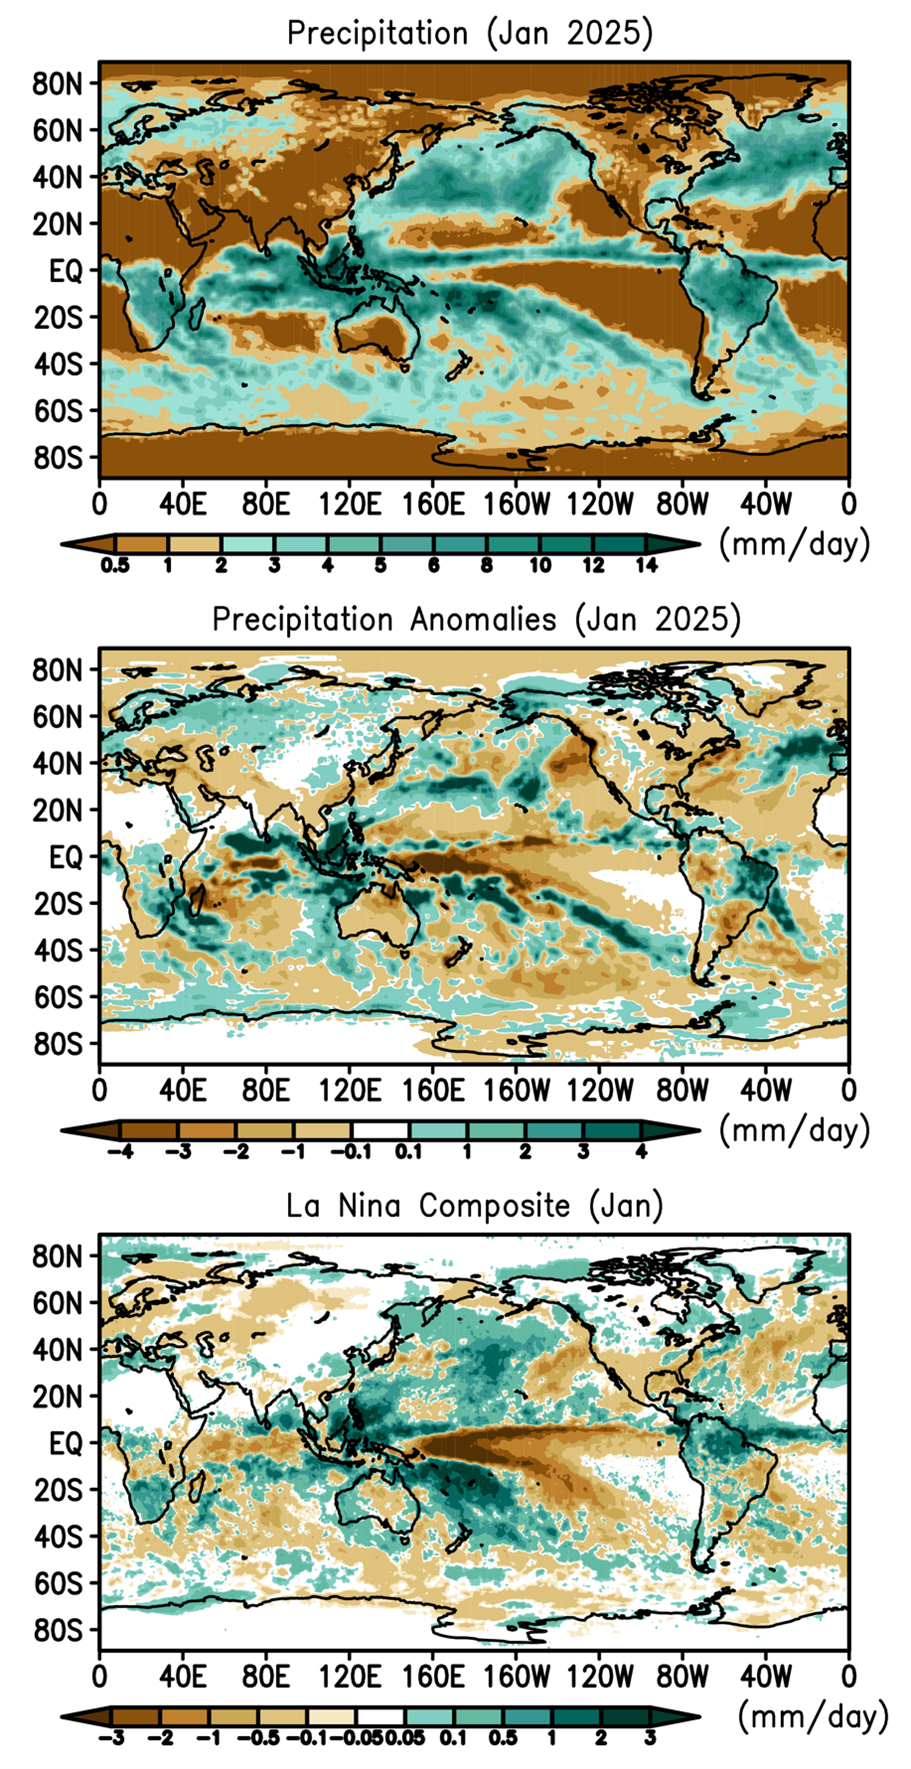
Although this month’s positive anomaly over Central America and the Caribbean agrees with the La Nina composite, the composite has a strong positive feature centered in the north of South America, while this month’s pattern has the strong positive anomaly further to the east and extending along the Atlantic ITCZ. Overall the pattern correlation between the monthly anomaly maps and the ENSO composites (Fig. 2) is again near +0.4 for the La Nina composite this January, again indicating a weak, but real relation. With the current La Nina generally forecast to dissipate in the next few months, we should expect a drop in this tropical correlation.
During January the British Isles were hit by a number of mid-latitude cyclones tracking across the Atlantic bringing high winds and significant precipitation, including a bout of flooding in northwest England at the beginning of the month. Near the end of the month a cut-off low delivered an extended period of heavy rainfall and accompanying flooding to Portugal and western Spain. These storms helped to produce the positive anomaly for this month in this region. Further to the east northern Europe tended to show precipitation surplus, while further to the east and south dry conditions predominated, helping to extend drought in many of these areas.
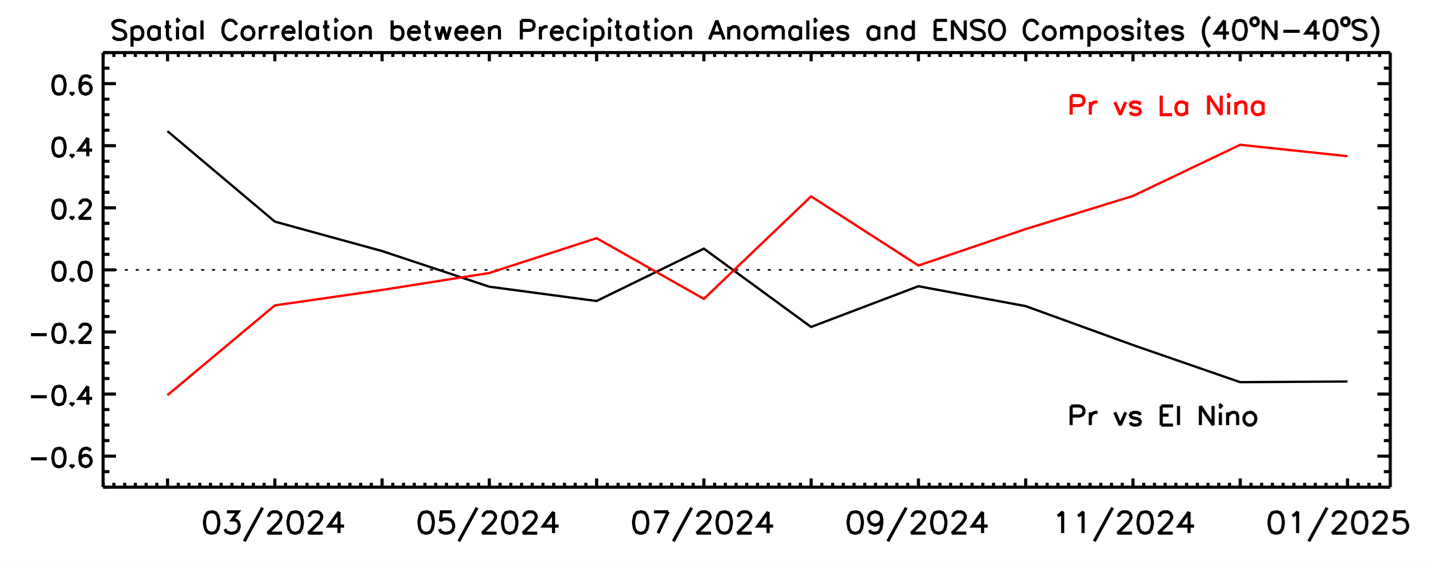
On a global scale Fig. 3 has the monthly anomaly of global precipitation (top panel) and the global surface temperature anomaly (bottom panel). The last 18 months or more have been record setting in terms of high global surface temperature, due to global warming and the El Nino occurring during the early part of the period. The global precipitation has also been relatively high, due also to the El Nino in the early part. However, during 2024, even as the tropical system transitioned to La Nina, the global temperature stayed high and the global precipitation generally remained above the long-term average. For this past month, however, the global precipitation has come back down. The numbers in Table 1 indicate that the global (land+ocean) mean is right at the climatological mean, although the land/ocean distribution still shows the ocean to be slightly above average, perhaps indicating the effect of still warm SSTs, despite the current La Nina. If, as forecast, the La Nina fades and neutral ENSO conditions follow, will surface temperatures again move higher, and will the global precipitation mean numbers stay near the long-term level?
Table 1 Global precipitation and anomalies in January 2025.
| Mean Precipitation (January 1983-2024) | Precipitation (January 2025) | Precipitation anomaly (January 2025) |
Land+ocean | 2.81 | 2.81 | +0.00 |
Land | 2.11 | 2.07 | -0.04 |
Ocean | 3.11 | 3.13 | +0.02 |
A note on the “record” global precipitation number for 2024.
In our Summary for “Global Precipitation for 2024” we issued last month, we noted that the number calculated then had set the record for highest global precipitation for a year. We did mention that the number would be revisited with later data. When we did that very recently, it turned out that the better data gave a slightly smaller estimate for 2024 that put 2024 in third place, although very close to other two peaks.