")
Headlines
- Northern Hemisphere summer conditions for July provided high surface temperatures (land and ocean) and extremes in precipitation, including a flood tragedy in Texas
- Overland the high temperatures connect with lack of rain to provide conditions for wildfires in multiple N.H. continents
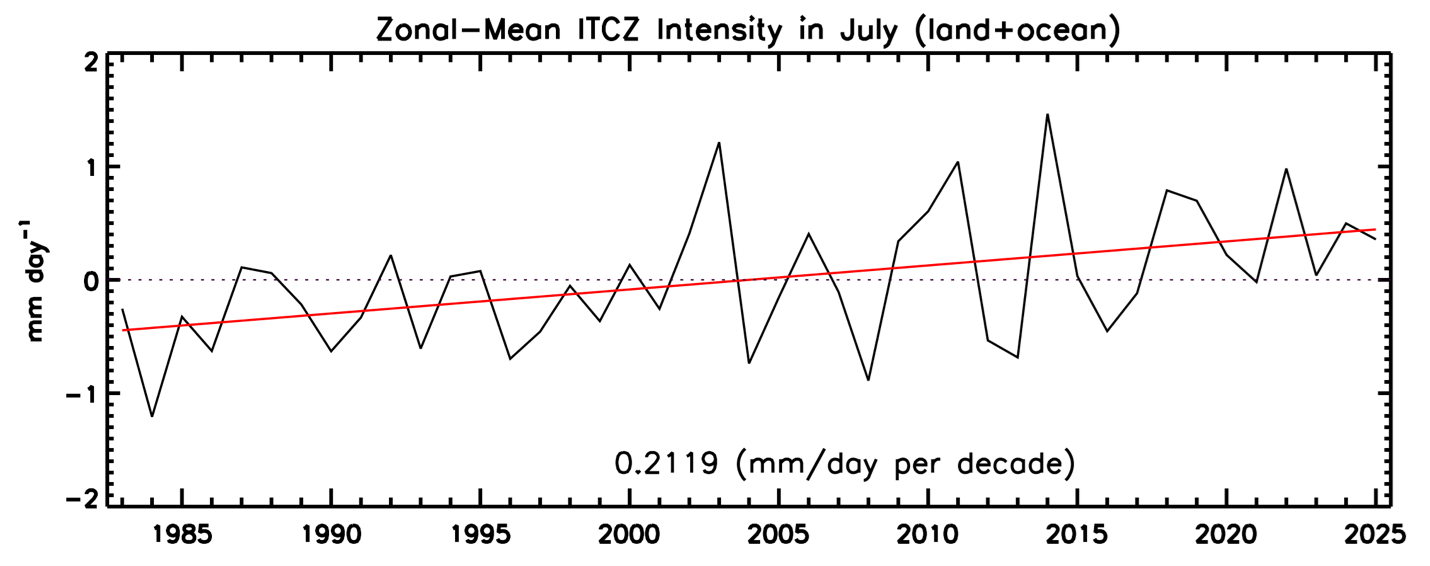
- A long-term increase in ITCZ rainfall intensity a strong indicator of how our planet’s climate is changing
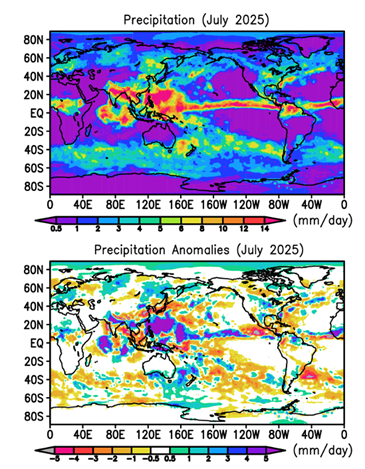
The strongest rainfall feature for July covers the Philippines and to the east with a strong ITCZ across the central Pacific (Fig. 1). The South Asian monsoon rains also continued to be plentiful over most of the Indian continent and Indochina. Negative anomalies surround these rainy monthly features. This same type of feature was evident in June and the positive anomaly seems to be associated with tropical cyclone activity in this area, but with the storms avoiding (for the most part) hitting land. A little further south the island of New Guinea has a positive anomaly, continuing the north-to-south flip-flop pattern. This pattern includes a dry swath running from central and eastern China to the east through Japan and into the mid-latitude Pacific. But just north of this dry zone over northeastern China the anomaly field shows a small, distinct positive anomaly, which was over Beijing, especially on the north side, where a significant flood event occurred late in the month. There were also floods nearby in South Korea.
Across the rest of the tropics Africa is generally wet, but the Atlantic ITCZ has strengthened and shows a shift to the north as we await more tropical cyclone activity. Northern South America still has a positive anomaly (as last month). Central America is relatively dry, but Mexico shows some benefits from its part of the North American monsoon. Australia seems to have a “normal” cool season amount of precipitation this July.
North America displayed both dry and wet extremes of rainfall and resulting consequences this month. The pattern of anomalies has most of the western U.S. west of the continental divide in a dry, negative zone. Continued drought in these areas led to a large number of wildfires from California through Nevada, Utah, Arizona, New Mexico and western Colorado. The vaunted North American Monsoon usually active in July did not help alleviate the dry conditions this year. Dry conditions also were located in the southeast and northeast U.S., although TS Chantal produced flooding in the Carolinas.
In between the dry zones rainfall excess was typical from the upper Midwest (Montana to Minnesota) south to Texas. There was some accompanying floods in the upper Midwest, but Texas suffered a terrible loss. Heavy rains over a series of days early in the month resulted in the relatively small scale monthly rainfall maximum in central Texas, which shows up as a small dot on the anomaly map. Most of that rain fell in just a few days, and in one case in a few hours, causing a tragic flash flood occurring during the night and early morning along the Guadalupe River in Kerr County killing 135 people, including many children attending camps along the river edge. The very intense rain was related to extreme moisture values associated with very high SSTs over the Gulf of Mexico and to remnants of TS Barry which were still hanging around the area.
Across central Europe (east of France) above normal rainfall helped alleviate the ongoing drought somewhat, but elsewhere things remained very dry and wildfires were reported over areas from Spain and Portugal to the west through France, Greece, Turkey and Syria.
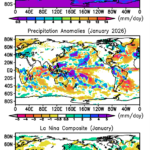
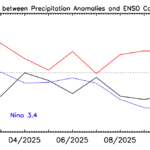
From an SST perspective ENSO is neutral with a Nino 3.4 of -0.1K for July (and -0.3K for the relative 3.4 index). The pattern correlation between the July 2025 anomaly map (40N-40S) and our El Nino/La Nina composites is essentially zero, emphasizing the neutral ENSO state of things. However, even under neutral ENSO conditions this summer in the Northern Hemisphere has been “hot” both over land and over near-land ocean regions (e.g., Gulf of Mexico and the Mediterranean). This leads, it seems, to high moisture conditions advecting from the ocean onto land and resulting floods, and where over-land conditions remain dry the high temperatures exacerbate already dry conditions producing drought and setting the stage for wildfires. Large-scale conditions driving dry and wet extremes in rainfall and their consequences.
On a global basis the global surface temperature dropped down to about the trend line (third warmest July on record) [see Fig. 2, bottom panel]. The global precipitation number (Fig. 2. top panel) has popped back up to near the long-term mean (see also Table 1). The land-ocean distribution has also struck a balance with very small anomalies, expected under neutral ENSO conditions.
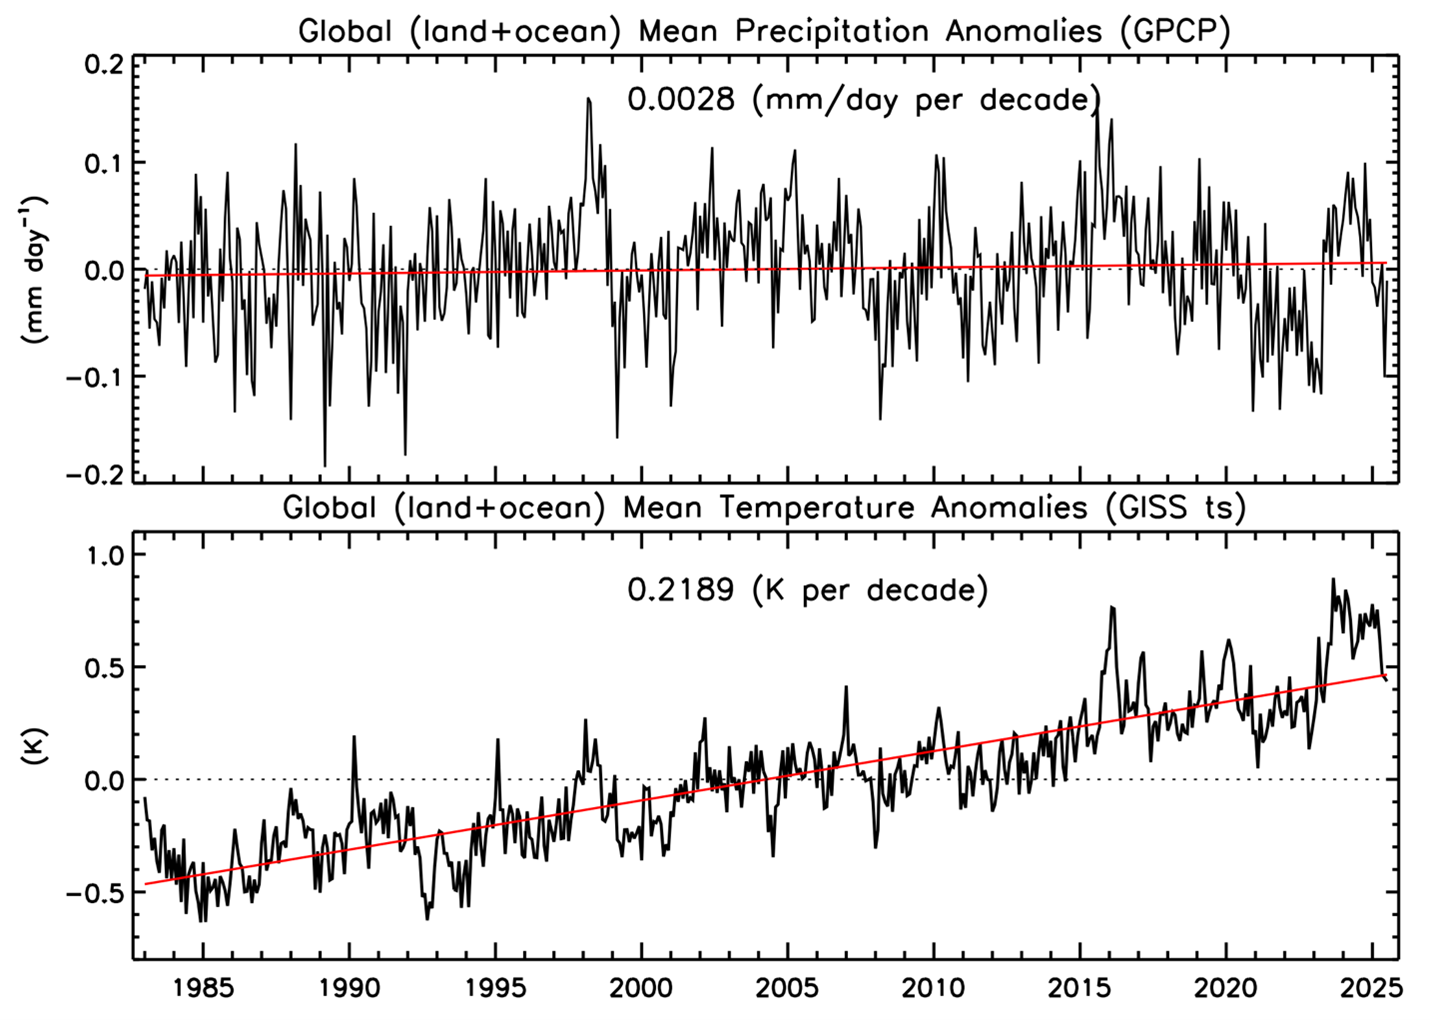
Table 1 Global precipitation and anomalies in July 2025.
| Mean Precipitation (July 1983-2024) | Precipitation (July 2025) | Precipitation anomaly (July 2025) |
Land+ocean | 2.87 | 2.86 | -0.01 |
Land | 2.50 | 2.53 | +0.03 |
Ocean | 3.02 | 2.99 | -0.03 |
Although Fig. 2 shows little, if any, trend in the global precipitation number, regional trends have been noted and a key large-scale trend can be seen for ITCZ Intensity in Fig. 3, here defined as the peak zonal mean monthly precipitation in the tropics at 0.5° latitude resolution, in this case for July. No surprise, the ITCZ is intensifying. Essentially the same slope can be seen for mean annual conditions. When you have peak rainfall increasing, even at the large-scale of Fig. 3, there are compensating dynamic and energy effects driving a compensating drying result elsewhere. That is what is happening that gives rise to more or more intense floods and wider and more intense droughts leading to more wildfires.