")
Headlines
- SST index ENSO neutral conditions continue in June, but with positive rainfall anomalies scattered over South Asia and around the Maritime Continent and over Central America and the far eastern Pacific.
- Southern Europe has a heatwave with accompanying dryness and wildfires
- Northwest U.S. still dry along with western Canada with their own wildfires
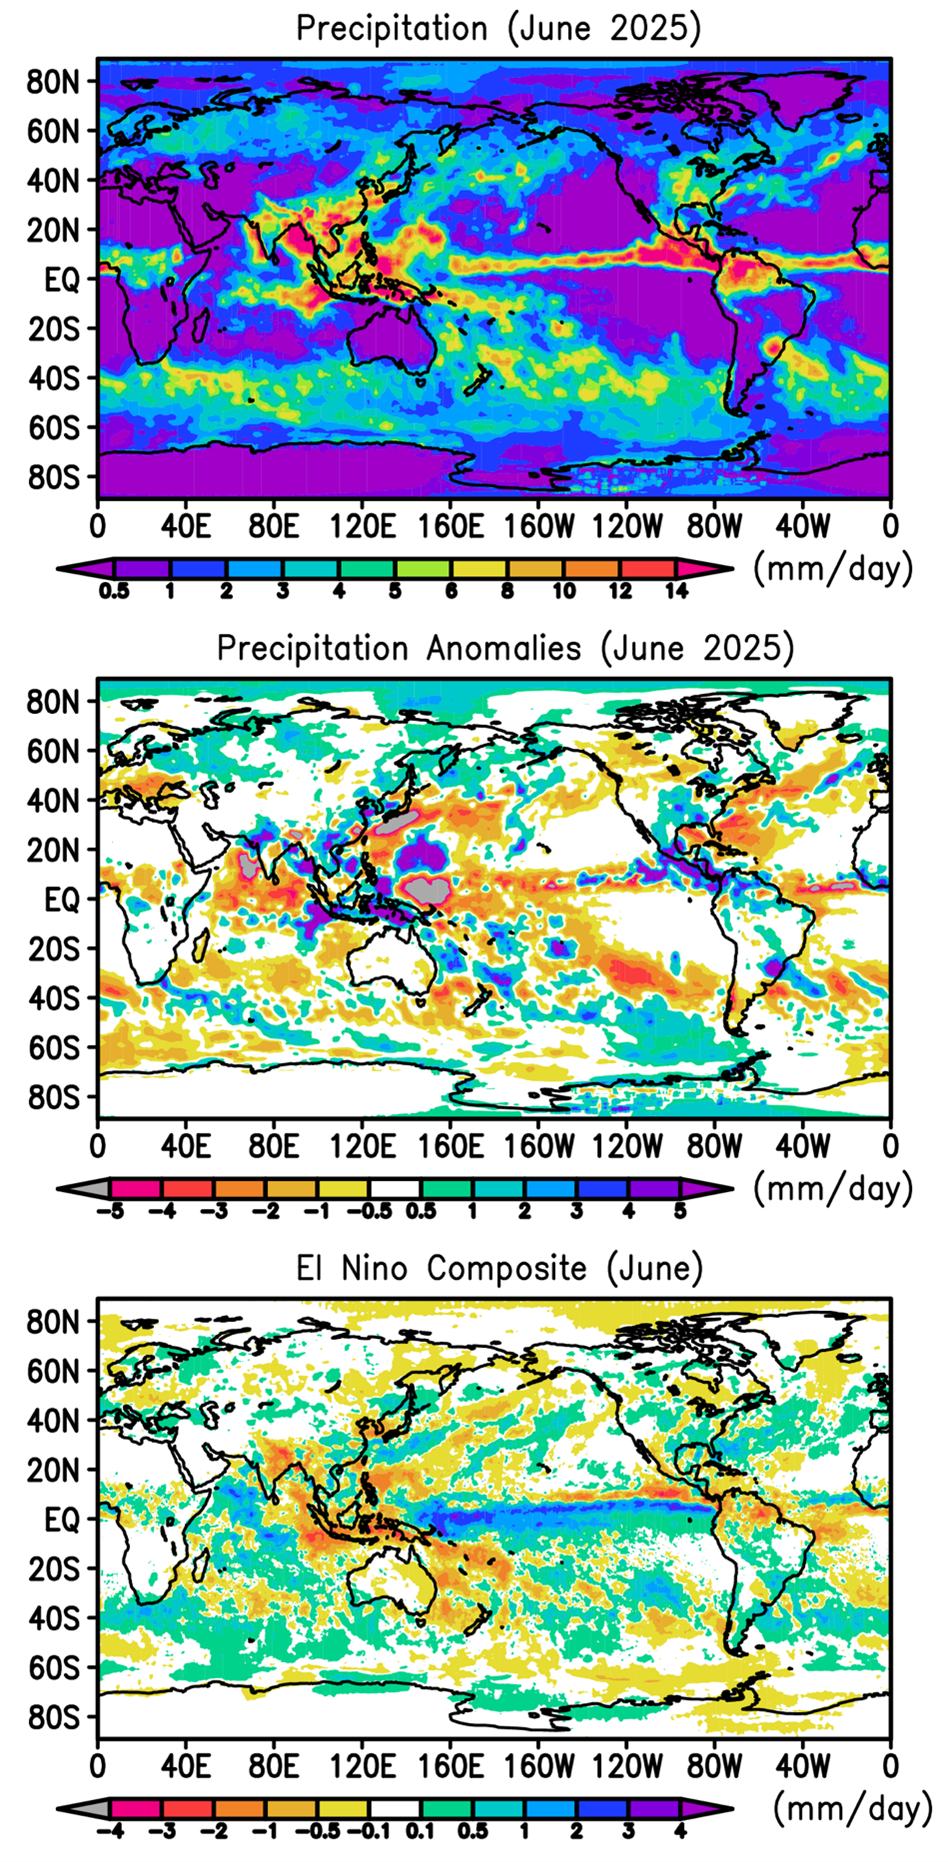
The South Asian monsoon was intense (Fig. 1, top panel) in June with positive rainfall anomalies (Fig. 1, middle panel) in northern India and across into much of Indochina and southern and eastern China, with reported flooding in various locations. The rainfall surplus even extends over Korea and Japan, although just to the south of Japan a negative anomaly reflects a northward shift of the Meiyu front. The positive rainfall anomaly also extends southeastward over the Philippines and the Maritime Continent and surrounding waters. The western tropical Pacific has an unusual positive (north)/negative (south) couplet partly due to tropical cyclone activity in the northerly feature, but some unresolved data questions, especially in the strong negative anomaly feature. Australia is mostly dry for this June, i.e., negative rainfall anomalies.
The Nino3.4 SST Index was again near zero in June indicating neutral ENSO conditions in the central Pacific, but the La Nina composite for June is included in Fig. 1 (bottom panel) because this June’s anomaly map still seems to have a ghost of La Nina patterns. In fact the spatial correlation is still slightly positive between the middle and bottom panels (40N-40S) and a little more positive this month compared to this month. Model forecasts have tend to favor weak La Nina conditions evolving over the next few months.
Across the Pacific ITCZ there is a mottled pattern of anomalies, mostly negative, until one approaches the Central American coast where positive anomalies dominate and extend over northern South America. The offshore rainy feature here is related to early season eastern Pacific tropical cyclone activity, including Hurricane Erick which hit southern Mexico.
Across the U.S. the region east of the Rockies was generally wetter than normal, but the west and especially the northwest U.S. and western Canada were dry. Wildfires continued to be a problem in the west and Canada, while floods occurred in Kansas, West Virginia and San Antonio, TX. This again looks like the La Nina pattern.
The tropical Atlantic was drier than average, reflecting a slow start to the tropical cyclone season. The Atlantic ITCZ has a clear negative rain anomaly, along with the Gulf of Mexico and the western Atlantic.
Much of Europe suffered through a heat wave during the month, accompanied by dry conditions, continuing their drought, and leading to an early start to their wildfire season.
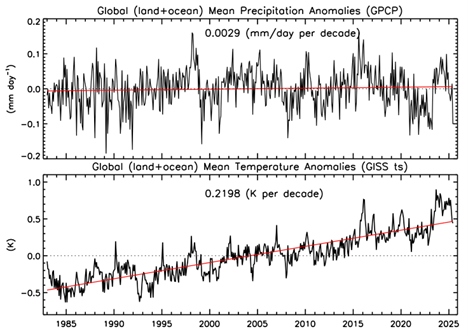
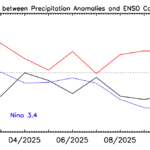
This June had the 3rd highest global surface temperature for June (2023 and 2024 were the top two), despite this past month being about ENSO neutral (see Fig. 2). The global surface temperature anomaly returned to the long-term trend line, while global precipitation anomaly dropped quote a bit below the long-term, steady mean. Table 1 gives the numbers and indicates that the global negative anomaly for the month is driven by the ocean negative anomaly, while the land value is positive. This distribution (ocean low, land high) is also often the case with La Nina conditions.
Table 1. Global precipitation and anomalies in June 2025.
| Mean Precipitation (June 1983-2024) | Precipitation (June 2025) | Precipitation anomaly (June 2025) |
Land+ocean | 2.87 | 2.77 | -0.10 |
Land | 2.30 | 2.45 | +0.16 |
Ocean | 3.11 | 2.90 | -0.21 |