")
Headlines:
The ongoing La Nina weakens in March in terms of Pacific SST anomalies, but the La Nina tropical rainfall anomaly pattern remains in place, lagging the SST field
Dry conditions lead to wildfires in the Carolinas and in South Korea, while floods dominate northeast Australia—fitting the La Nina typical pattern
The global land-ocean precipitation split still shows the La Nina scheme of land high and the ocean relatively low, even as global temperature remains high, even relative to the long-term trend
A double ITCZ is visible in the eastern Pacific, typical of NH Spring
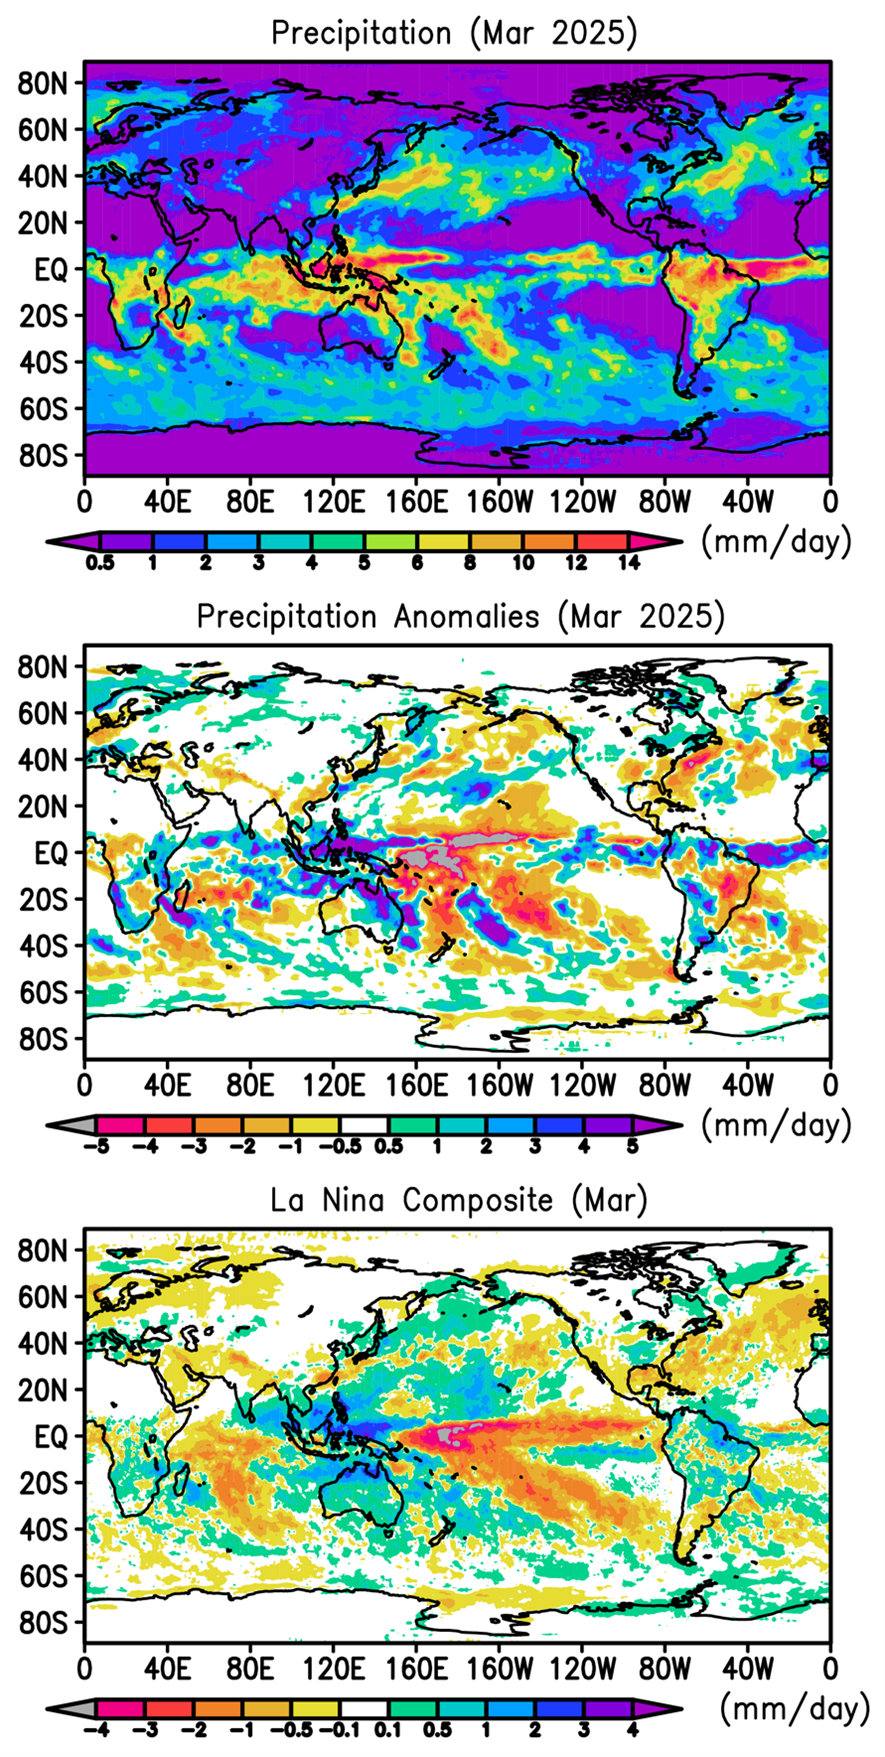
Looking at the top panel of Fig. 1 one sees the somewhat usual distribution of global precipitation for a month of March. But there is something missing. In the middle of the Pacific along the Equator the ITCZ just about disappears. The anomaly field in the middle panel clearly shows the associated, dominating deficit feature over the central Pacific. Along with the excess rainfall anomaly feature further west over the Maritime Continent and surrounding waters, this couplet signifies the ongoing La Nina, still apparently strong in terms of the Pacific rainfall field. But the Nino 3.4 SST anomaly index is already slightly positive +0.1C for the month. What’s up? But, the Relative Nino3.4 index (see NOAA CPC for explanation), which takes into account ocean warming over the last 20 years, is still slightly La Nina at -0.4C. But the Nino 3.4 trend over the last few months is definitely positive (warming) indicating La Nina weakening, but the rainfall pattern lag (lagging the SST numbers) and the regular vs. relative Nino3.4 discrepancy point to what is obviously a still strong La Nina rainfall pattern in the tropics. We will explore the extent of the La Nina effect this March and its recent evolution in the following paragraphs.
The third (bottom) panel in Fig. 1 gives the La Nina anomaly composite for the month of March based on previous La Nina events during March. One can immediately see the general similarity between this March’s anomalies and the La Nina composite, especially in the tropics from the Indian Ocean eastward to the Atlantic. Also affected is the SPCZ (South Pacific Convergence Zone), which shifts an alternating pattern westward serving up excess rainfall over the northeast coast of Australia. In the early part of the month TC Alfred lingered just off shore of the Brisbane region (furthest south along coast since 1974) producing flooding (with 15” of rain) even as it dissipated. And the region had additional bouts of heavy rain with coastal convective systems in Townsville and other parts of Queensland province. This is typical of ENSO in Australia: El Nino and wildfires; La Nina and floods. Although this March western Australia remained dry, although the composite shows positive rainfall anomalies over essentially all of the continent.
As mentioned before the Maritime Continent land areas and surrounding seas generally have positive rainfall anomalies during La Nina (see middle and bottom panels of Fig. 1). North of that is a negative anomaly area running across South Asia, Indochina, eastern China and over the Korean peninsula, similar to the La Nina composite. This dry zone, accompanied by a longer drought over parts of South Korea contributed to wildfires there that killed 24 people. To the west, over the South Indian Ocean a dry zone is evident east of Madagascar, but tropical cyclones tracked west of Australia both north and south of that zone producing rainfall excesses in the monthly map with some flooding in northern Madagascar and coastal Mozambique. The rest of southern Africa has a variable anomaly pattern, somewhat similar to the La Nina composite.
Over Europe dry conditions dominate over the U.K. and western Europe (with the exception of the Iberian peninsula), while most of the Mediterranean and eastern Europe tend to be wet. This European pattern is somewhat similar to the La Nina composite, perhaps pointing to the Pacific’s influence this far away, even in moderating ENSO conditions. Turkey is dry, but just to the east there were floods in Iraq.
In the Americas relatively dry La Nina conditions persist in the U.S. Southwest and Mexico and in parts of the eastern U.S. Wildfires were reported during this March in Oklahoma, North and South Carolina and on Long Island. On the other hand, a strong, long-lived convective system produced flooding with 6-10” of rain on the south tip of Texas and into Mexico. Over South America the continued pattern of positive anomalies across the northern, equatorial band and negative anomalies along the eastern coast continued to hold, again slightly similar to the La Nina composite map. But even further south there was flooding in southern Argentina. There were also floods in Bolivia and the northwest coast of the continent had significant rainfall associated with the El Nino Costero (warm waters just off the coast). There is a hint of a double ITCZ in the eastern Pacific in the top panel, typical of this time of year.
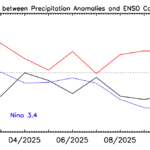
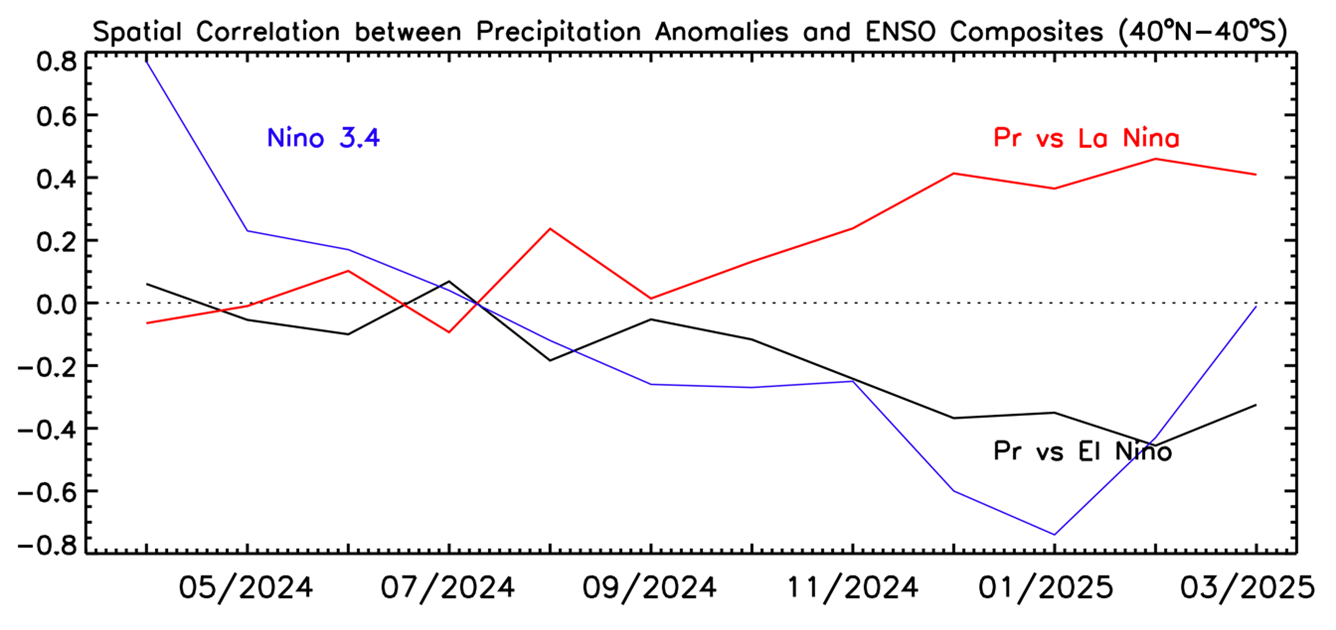
Figure 2 summarizes the La Nina status and recent evolution in terms of SST and rainfall. The pattern correlation across the tropics between this March’s anomaly pattern and the La Nina composite (red curve) remains elevated, while the Nino3.4 index is rapidly warming, indicating a large-scale rainfall pattern lagging central Pacific temperatures.
Globally the mean surface temperature was one of the highest Marches on record, the global precipitation was estimated to be very close to the long-term mean (see Fig. 3 and the Table below). The split between overall land and ocean anomalies still shows the La Nina configuration of a positive split over land and a negative anomaly over ocean as a whole. As we likely move toward more neutral ENSO conditions the land/ocean precipitation differentiation should equalize, while surface temperatures stay higher than the long-term trend line.
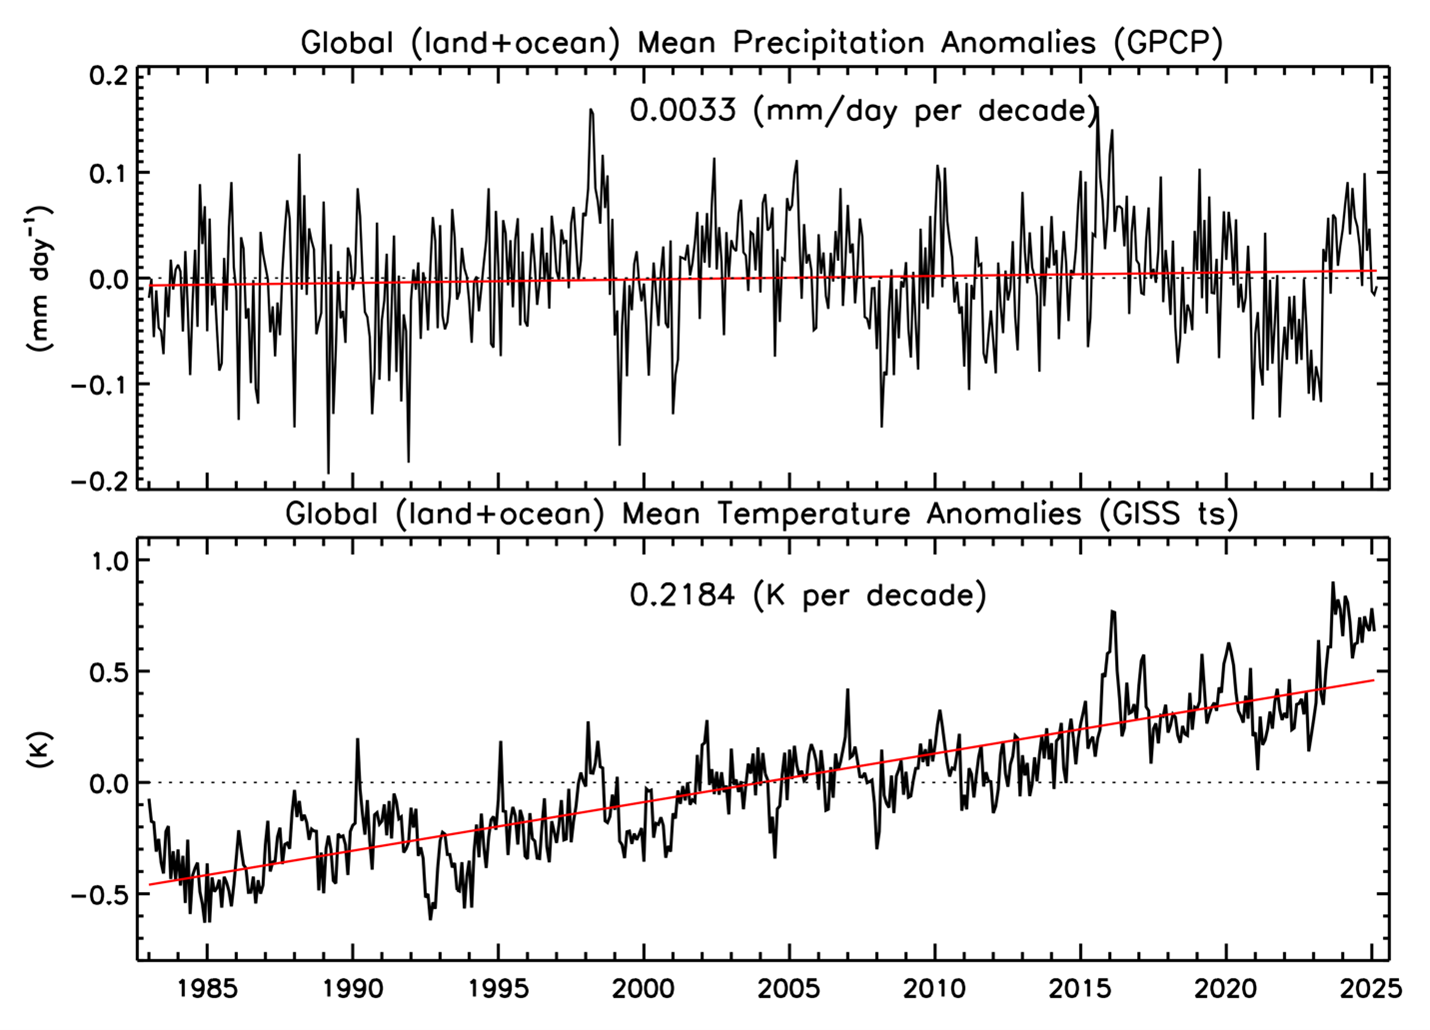
Table 1 Global precipitation and anomalies in March 2025.
| Mean Precipitation (March 1983-2024) | Precipitation (March 2025) | Precipitation anomaly (March 2025) |
Land+ocean | 2.80 | 2.79 | -0.01 |
Land | 2.13 | 2.28 | +0.15 |
Ocean | 3.08 | 3.00 | -0.08 |