Headlines:
- The summer South Asian monsoon gets a strong early start, with associated floods in Mumbai
- ENSO nears a very near neutral SST index, and the La Nina pattern correlation falls to zero, i.e., La Nina is finally over in the rainfall pattern.
- Dry conditions in Canada associated with wildfires in Manitoba
- A weak, short-lived TS Alvin in the eastern Pacific starts the tropical cyclone season, but spreads needed moisture and rain into southwest U.S.
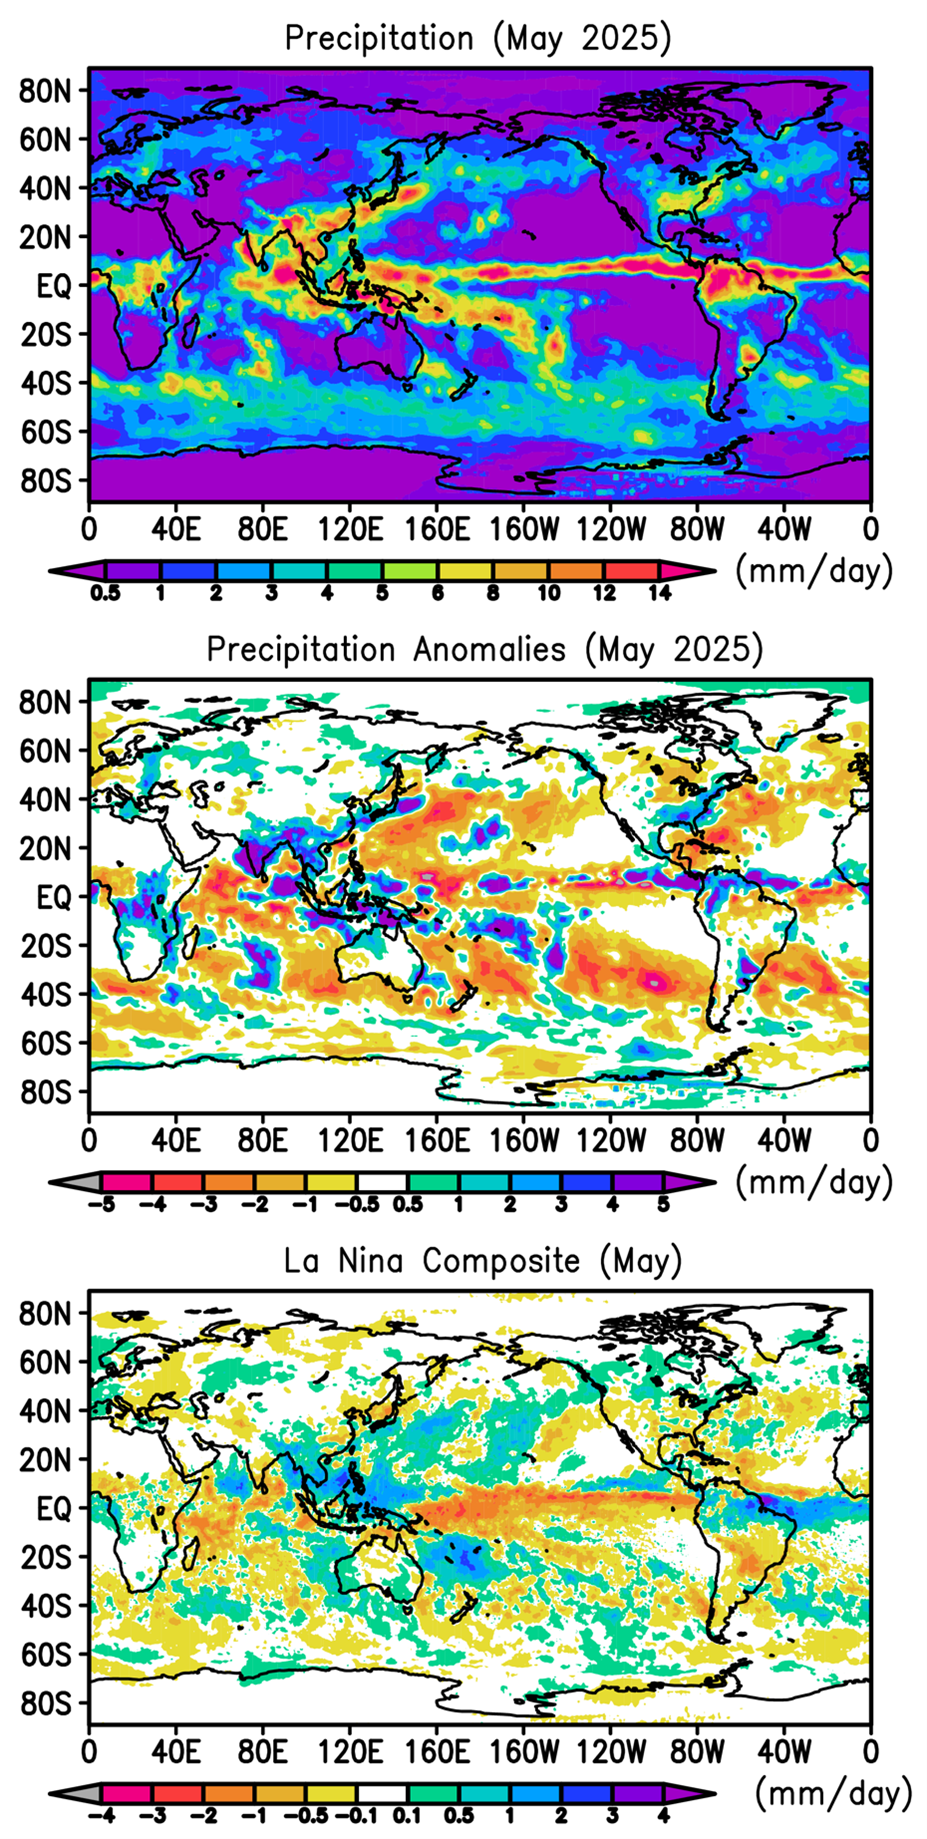
As we examine this May’s global precipitation map the NH spring prominent double ITCZ in the Pacific has mostly disappeared, with just a remnant in the central Pacific (Fig. 1; top panel). An early start to the South Asian monsoon is also very evident along with heavy rain in northern South America connected to the Atlantic and Pacific ITCZs. The anomaly map for this May shows (middle panel) the continued weakening of the La Nina pattern of the last months, with the major negative feature of the central Pacific ITCZ mostly vanishing. The Nino 3.4 SST index for the month was approximately -0.2C, very near neutral. The still positive rain anomaly over the Maritime Continent still fits the typical La Nina pattern, but the La Nina pattern correlation has fallen to zero (see Fig. 2). The tropical rainfall pattern has declared that La Nina is over.
The early start to the Asian monsoon is obvious in the anomaly map with big positive anomalies especially over India and to a lesser degree over Indochina. The Indian feature was associated with large floods in Mumbai with the wettest May on record in the city. There were also floods in southwest China and eastern China, Korea and Japan had substantial late spring rainfall.
South America has the wet La Nina-type pattern in the north with negative deficits covering most of the continent south of there, except for a in Argentina. The Gulf of Mexico is relatively dry. But in the last two days of the month Tropical Storm Alvin formed as the first named storm of the season in either the Atlantic or Pacific, but rapidly weakened, but left significant moisture and much needed rainfall spreading into Mexico and the southwest U.S. into early June.
The eastern U.S. was in general wet, alleviating drought in some areas, but with accompanying severe thunderstorms and tornadoes mainly in the Midwest. Further north dry conditions across much of Canada were associated with wildfires, especially in Manitoba, where 17,000 people were evacuated as a precaution. Smoke from those fires spread into the U.S. and way beyond.
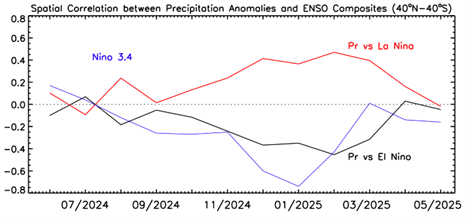
In terms of ENSO, La Nina dominated the last 12 months, although during that year-long period the first few months were neutral and the La Nina developed slowly and peaked from December 2024 to March 2025 (see Fig. 2) and then gradually faded. Overall it was a weak La Nina from a SST, Nino 3.4 standpoint. So what was its impact?
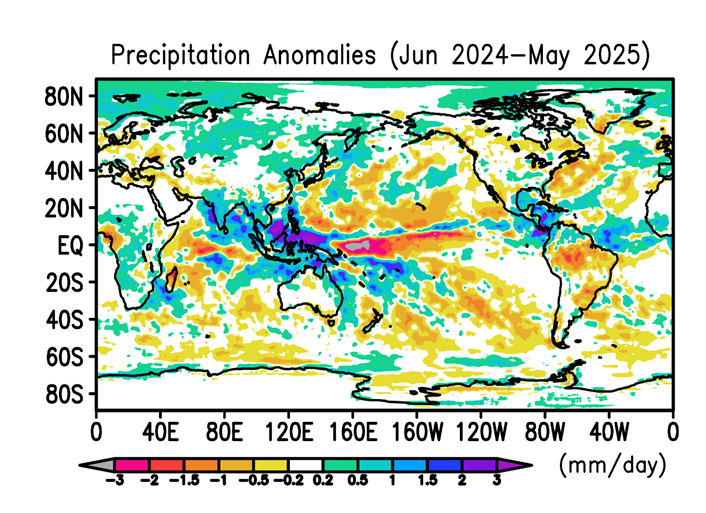
Figure 3 shows the 12-month anomaly map for the period and the very strong negative anomaly centered along the equator in the western Pacific and the intense positive rainfall anomaly over the Maritime Continent region and stretching west into the eastern Indian Ocean with dry conditions into western Indian Ocean and eastern Africa. Other features over South and North America and even Europe are typical La Nina rainfall variations.
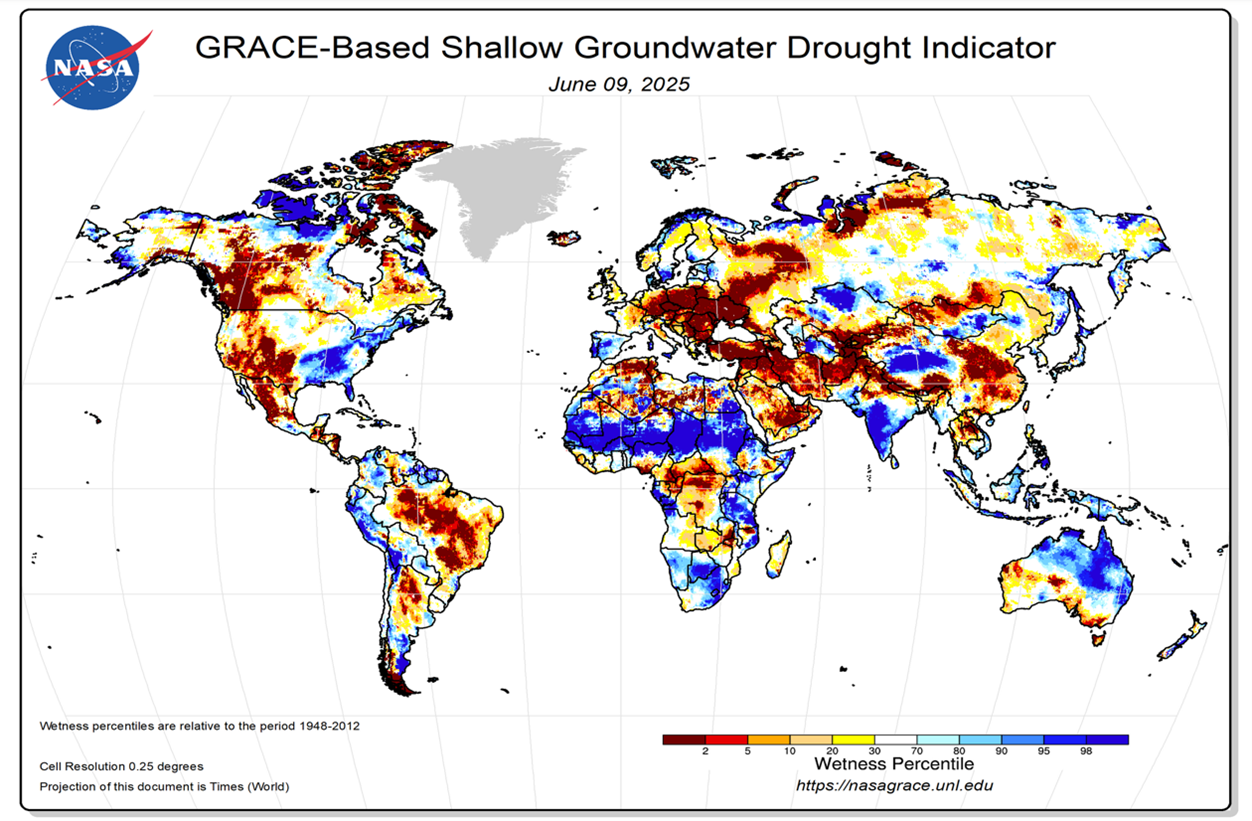
In general La Nina conditions provide more precipitation over land areas (less over ocean). However, the regional shifts provide wet and dry areas and even though precipitation is just one component of drought, it is the biggest factor. So, when one looks at drought calculations as in Fig. 4, one can see a strong correspondence between Figs. 3 and 4 and see the influence of even this relatively weak and relatively short-lived La Nina. One can see the dry/wet contrast over the U.S., the drought conditions in Canada and wet areas in India and northeastern Australia. Even the dry Iberian peninsula and dry eastern Europe are driven by the seasons-long precipitation patterns, in turn at least partially driven by ENSO.


