Headlines
North America overwhelmingly dry, except for southern Rocky Mountains and Florida
La Nina rainfall anomaly pattern evident in the Western Pacific along the Equator, but very weak beyond that.
Western Europe wet with devastating flash flood in Spain
Tropical cyclone rainfall tracks evident and contribute to record October ocean rainfall
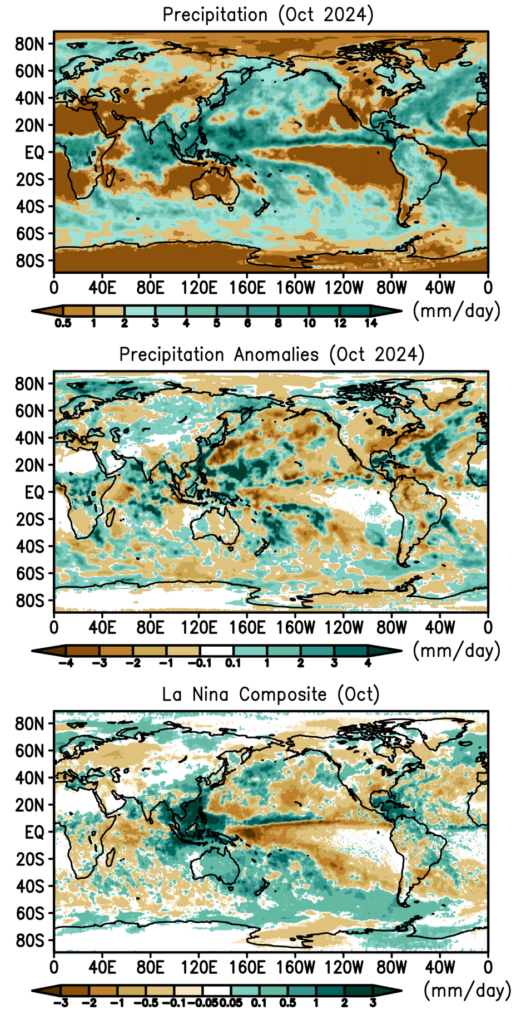
The year 2024 is on track to probably be the warmest ever and October is contributing to that, although a slightly La Nina tropical SST pattern (Nino 3.4 ~ -0.4 K) restrains its fullest temperature impact. The precipitation pattern for the month (Fig. 1, top panel) has the Asian Monsoon creeping southward along with ITCZ latitudinal positions and shows paths and results of tropical cyclones across the various basins, along with impacts over nearby land areas.
One very distinct non-feature in the top panel is the lack of precipitation over the North American continent—the U.S., Mexico and Canada are dry this month. The anomaly map in Fig. 1 (middle panel) emphasizes that dryness, with only a slight positive area over the southern Rocky Mountains with some early snow occurring there and even a serious flash flood around Roswell, NM. Another exception is Florida where Hurricane Milton passed west to east across the central part of the state after crossing the Gulf of Mexico after brushing the Yucatan. South America has some areas of significant rain (e.g., southeast Brazil), but also large areas of continuing dryness.
Across the tropical Pacific we look for a pattern associated with the weak La Nina index value and we find the ITCZ in the eastern ocean a little to the north, with a distinct negative anomaly to the west along the Equator between 160E and 180. This negative feature is a signature of La Nina as can be seen in Fig.1, bottom panel, which shows the October La Nina composite. Just to the west of that positive rainfall anomalies exist over the region of New Guinea, Borneo, Sumatra, the Philippines and surrounding waters; again this is a signature of La Nina. Part of this rainy feature was associated with Tropical Storm Trami hitting the northern Philippines and creating serious floods and 100 fatalities. However, Australia is dominated by negative anomalies this October, while the La Nina composite has positive anomalies there. There may be other same-sign regional links between the two lower panels in Fig. 1, but these may or may not be related to the status of ENSO. The overall pattern correlation between the middle and bottom panels is only slightly positive, indicating a weak La Nina effect on the tropical rainfall pattern.

The exiting monsoon over South Asia and the Indian Ocean/South China Sea this month left a varied pattern of anomalies, one associated with floods in Bangladesh and also positive rainfall anomaly tracks of tropical cyclones along the China coast, Taiwan and Japan. The ITCZ across Africa had a surplus of rain, but with the Horn of Africa mostly drier than normal.
Western Europe had significant rain and a positive anomaly and late in the month the Valencia region of Spain was hit by a monster flash flood with 200 fatalities, related to very warm SSTs in the nearby Mediterranean, enhanced evaporation, and production of very high absolute humidities and therefore the “fuel” for the intense convection, heavy rain and downstream flooding. Early in the month there were also floods in Bosnia.
Last month there was excessive rainfall in parts of the Sahara Desert. This month a rainfall positive anomaly is evident across Saudi Arabia, with flooding in Mecca and other regions.
Table 1 Global precipitation and anomalies in October 2024.
| Mean Precipitation (October 1983-2023) | Precipitation (October 2024) | Precipitation anomaly (October 2024) |
Land+ocean | 2.80 | 2.90 | +0.11 |
Land | 2.08 | 2.10 | +0.02 |
Ocean | 3.10 | 3.24 | +0.15 |
The global total precipitation for this October is a record for all Octobers in the record, with the ocean anomaly bouncing up from September, possibly related to the continuing warm SSTs and tropical cyclone activity (see Table 1).


