Headlines
La Nina pattern of tropical anomalies not obvious, although the Nino 3.4 index was -0.4 at the end of September
Dry conditions in western U.S. but with wet conditions in east with Hurricane Helene causing devastating flooding in western North Carolina and surrounding areas.
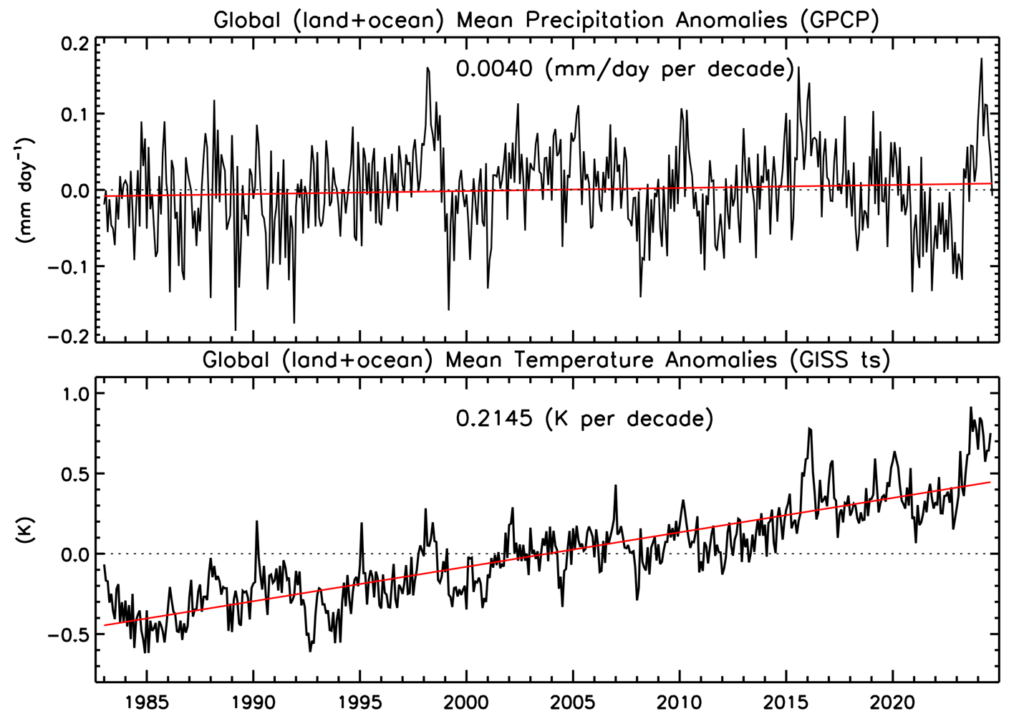
Global total precipitation for the month was very near the long-term mean after the large El Nino positive anomaly over the last year.
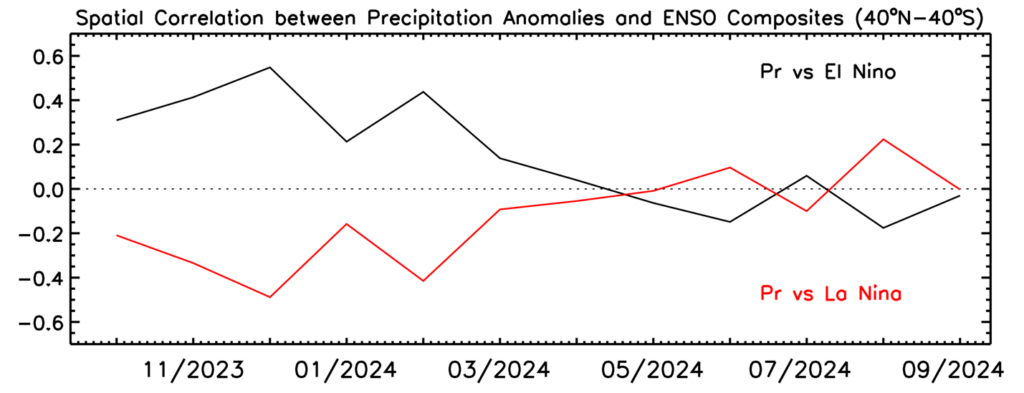
Tropical cyclones were active in September 2024 and the supposed transition to an overall La Nina precipitation anomaly pattern seemed to slow down. Fig. 1 shows the precipitation map for the month, the anomaly pattern and the typical (composite) La Nina anomalies for September. Although there seem to be some matches between the two anomaly panels, the time history of the pattern correlation (Fig. 2) indicates that overall the ENSO system is still struck near neutral, even though the Nino 3.4 index was -0.4 at the end of the month.
Over North America the western U.S. and western Mexico were very dry with wildfires in California, Nevada and Oregon. However, a different story held over the eastern U.S. with above average rainfall covering the Caribbean, Gulf of Mexico and particularly the southeast states. Early in the month Hurricane Francine formed in the western Gulf and came ashore in Louisiana. In Washington, DC and Baltimore it rained for 11 consecutive days (almost a record), although most of the rain was on the light side. However, Hurricane Helene formed in the Caribbean, hit Yucatan, crossed the Gulf of Mexico, came ashore on the Big Bend of the Florida coast and swept into Georgia and northward, devastating western North Carolina with huge amounts of rain and resulting floods and landslides. Along its entire path the result was over 100 deaths and in western North Carolina a tremendous property damage, even knocking out water systems, etc. These events all add up to the high monthly values evident in this region.
Over South America nearly the entire continent has negative rainfall with wildfires scattered across the region. Reports say one-half of Brazil is in an official drought designation. In South Asia and the Maritime Continent, where the La Nina composite calls for an intense and broad positive anomaly, this month’s pattern shows a very variable set of anomalies, small-scale and both positive and negative. Africa has a large positive anomaly across most of the northern half of the continent, with a dry area over the eastern Horn of Africa. The positive anomaly extends even into the Sahara Desert, with reports of five times normal rainfall with some flooding, including in northern Nigeria, and greener than normal conditions in the Sahara as observed in satellite observations.
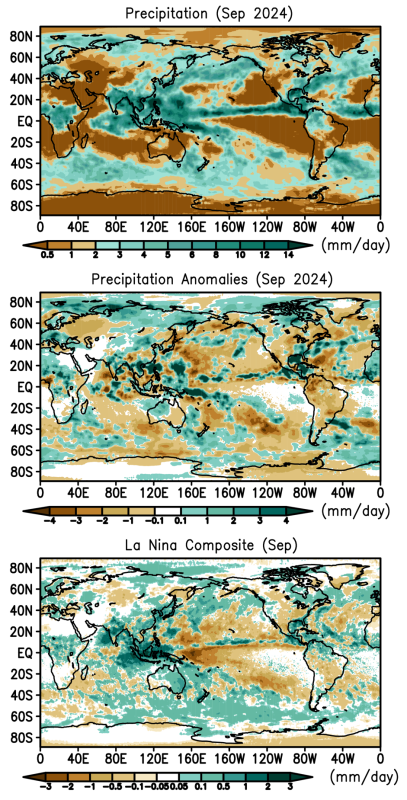
Over South Asia the monsoon and tropical cyclones were both part of the highly variable pattern of large rainfall amounts for the month. Typhoon Yagi came across the northern part of the South China Sea and hit China’s Hainan Island with heavy rain and flooded the northern part of Vietnam (e.g., Hanoi). There were also floods and landslides in Nepal with about 100 dead.
Central Europe shows a wet anomaly with flooding in Romania, the Czech Republic, Poland and Austria. However, to the west and south wildfires in Portugal and Greece are associated with dry conditions.
The global total precipitation anomaly for this September is very nearly zero, falling from the large positive global anomalies during the recent El Nino. The land/ocean division of the anomaly has land being somewhat positive and ocean negative, perhaps indicating a large-scale tilt toward La Nina conditions. It will be interesting to follow if and how La Nina affects the rainfall patterns over the next few months.
