Headlines
After a hot Northern Hemisphere summer, global precipitation for August remains just above average
The tropical rainfall anomaly pattern for August shifts slightly towards a La Nina-like pattern
Tropical cyclone tracks evident in Pacific (even Hawaii) and along U.S. east coast (with H. Debby), although rest of Atlantic quiet
August 2024 was again a very hot month in terms of mean global surface temperature, with this June-August period setting a global heat record. The global precipitation mean value also remained slightly above the August mean and as the El Nino to La Nina transition slowly continued, the tropical rainfall anomaly pattern began to resemble a more La Nina-like pattern.
The mean precipitation analysis for this August (Fig. 1, top panel) has the Asian monsoon with its usual swath of heavy rain across South Asia and also very intense Atlantic and Pacific ITCZs, along with the subtropical dry zones. The anomaly map for the month (Fig. 1, middle panel) has intense positive anomalies over parts of the Indian sub-continent and surrounding waters and eastward through Indochina and Indonesia and out into the Pacific. To the north of that feature and roughly parallel to that feature, a dry zone is evident. The dry anomaly dominates in the mid-Pacific along the Equator, although weakly. These features are somewhat correlated with similar anomaly features in the La Nina composite (Fig. 1, bottom panel). The pattern correlation numbers (Fig. 2) between this August’s anomaly pattern and the ENSO composites have the correlation for this month increasing from recent months, indicating a slightly larger La Nina effect on the precipitation patterns this month as one might expect with the Nino 3.4 SST index ending up slightly negative at the end of August.
Some of these positive anomalies were associated with flooding and landslide events in Bangladesh and northeast India (100 dead) and tropical cyclone activity alongside of Japan and even over Hawaii (Big Island), with 20” of rain (look closely in the anomaly map for the rainfall track). A little further east one can also see additional tropical cyclone tracks, with a negative anomaly to the south (somewhat like the La Nina composite), indicating the ITCZ in this area is located a little to the north than its usual position.
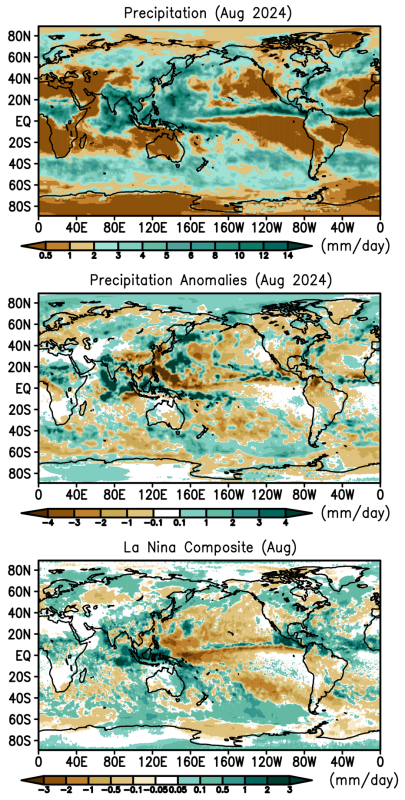
On the other hand, the Atlantic ITCZ is located a little to the south of its normal position (see the anomaly map), and that eastern Atlantic was devoid of tropical systems in August, in contradiction to the seasonal forecasts (so far) of an active Atlantic storm season. However, early in the month Hurricane Debby developed and provided copious rain for Cuba and along the east coast of the U.S. for Florida, Georgia and South Carolina (up to 10”) and then over Pennsylvania and New York state (5”). That storm track can also be detected in the August anomaly map.
South America is dominated by drier than normal areas for August, especially along the northern coast. North America is mostly covered by negative anomalies across the southern U.S. and northern Canada, with positive anomalies along the border between the two and along the aforementioned east coast and Alaska.
The rainfall regime over tropical Africa was active in August, with positive anomalies along its broad ITCZ and associated flooding in Nigeria and Sudan and even across the Red Sea in Yemen (100 dead). Western and Southern Europe were drier than average, with wildfires in Greece, very close to Athens. Further north positive anomalies were noted over central Eurasia.
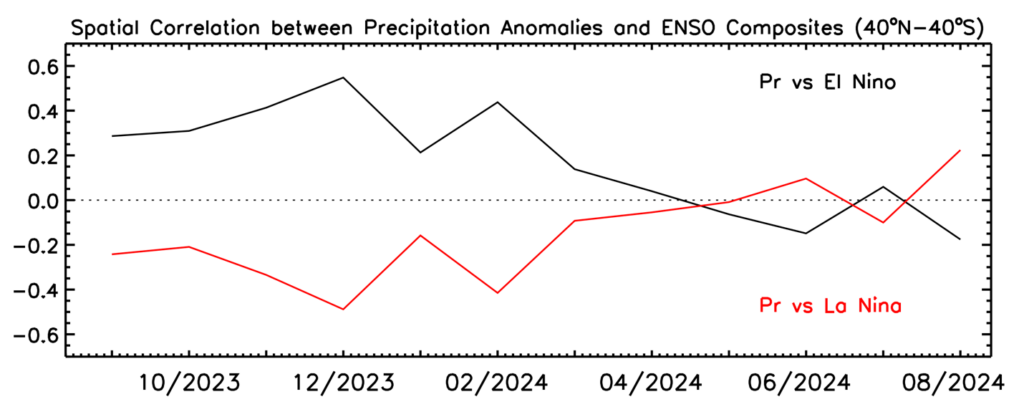
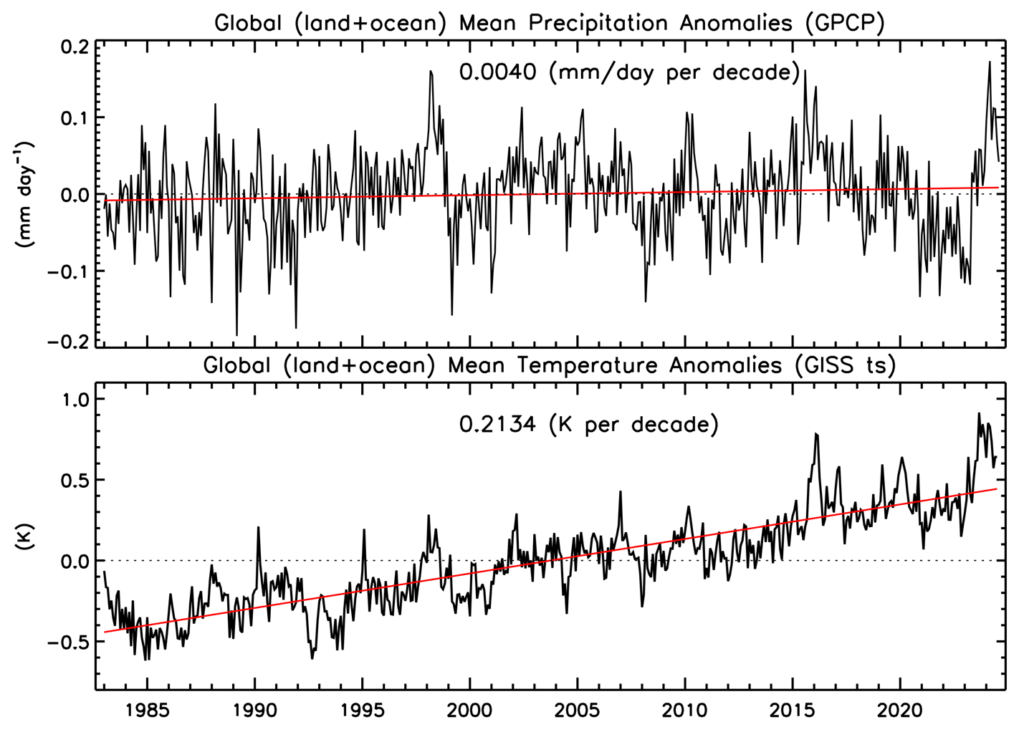
Figure 3 updates the global surface temperature and precipitation plots and shows the global precipitation still above average (+0.04 mm/d), but declining as we move (very slightly) into La Nina. One can see that the global precipitation number slightly lags the global surface temperatures.
