
Minnesota’s Changing Climate: A Northern Perspective of the 21st Century
Prof. Tracy Twine University of Minnesota Monday May 1, 2023, 2 PM ET Abstract: The north-central region of the United States is known for
")
Prof. Tracy Twine University of Minnesota Monday May 1, 2023, 2 PM ET Abstract: The north-central region of the United States is known for

Dr. Steven Goodman NOAA/NESDIS Monday April 24, 2023, 2 PM ET Abstract: Lightning is perhaps the most common natural hazard on Earth with an
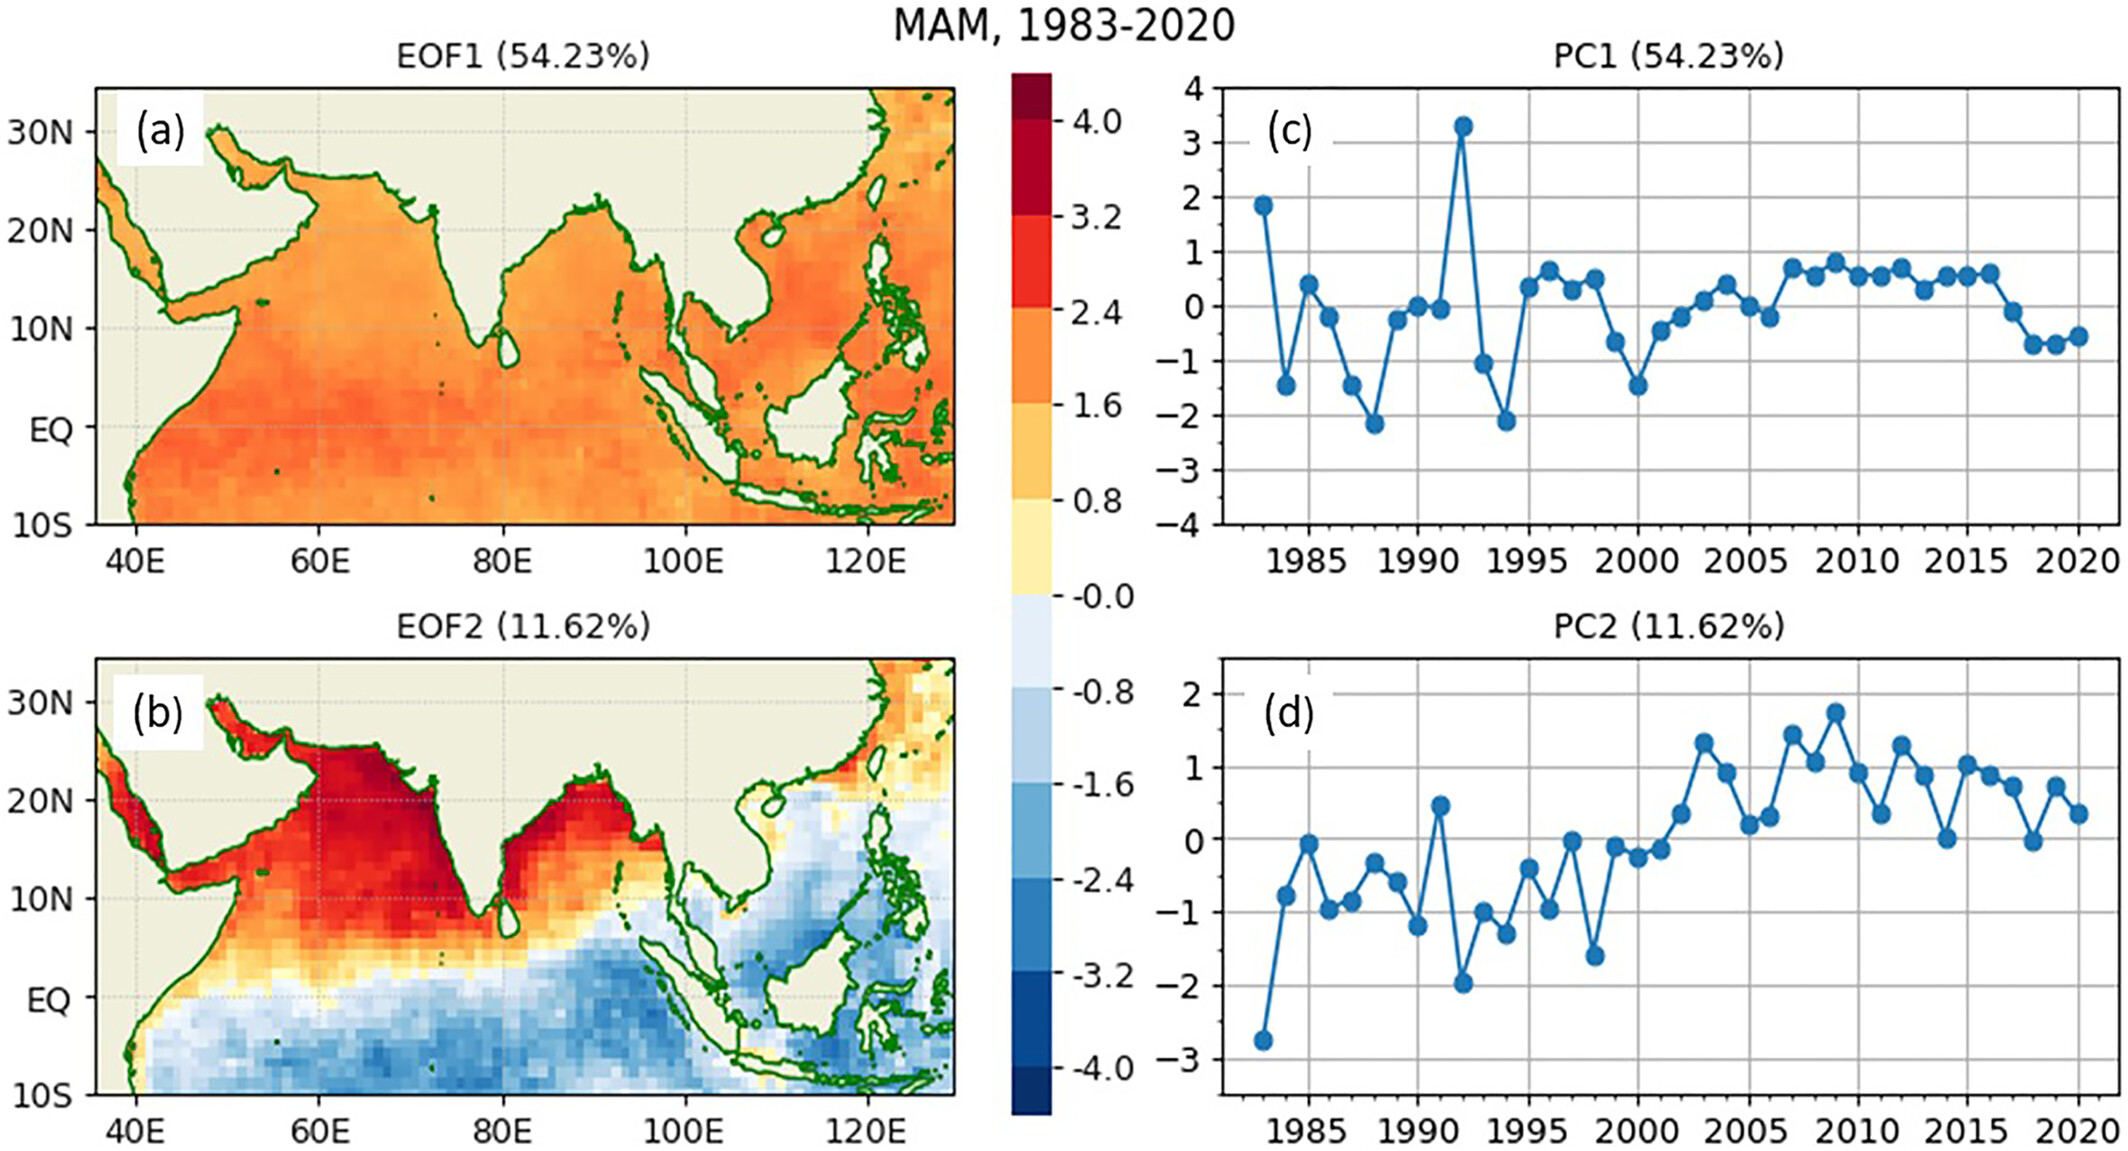
Figure 1: The leading spatial patterns (left panels) and the principal component (PC) time series (right panels) of Empirical Orthogonal Function (EOF) analysis on the
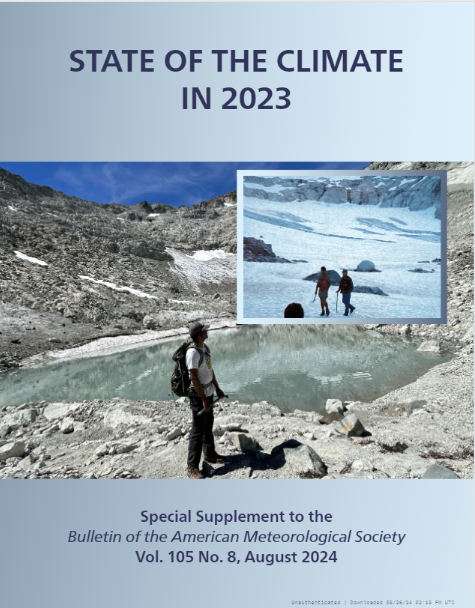
This week, the American Meteorological Society (AMS) released its annual State of the Climate report in 2023. Compiled by NOAA’s National Centers for Environmental Information,
This event has passed. See the seminar recording here: Dr. Tapio Schneider Theodore Y. Wu Professor of Environmental Science and Engineering California Institute of Technology
This event has passed. See the seminar recording here: Dr. Kevin Trenberth Distinguished Scholar National Center for Atmospheric Research Tuesday February 16, 2021, 3 PM
This event has passed. See the seminar recording here: Dr. William Collins Director, Climate and Ecological Sciences Division, Lawrence Berkeley National Laboratory Professor in Residence,
This event has passed. See the seminar recording here: Prof. Paul O’Gorman Professor of Atmospheric Science Massachusetts Institute of Technology Tuesday October 12, 2021,

This event has passed. View the seminar recording here: Prof. Timothy Delsole Department of Atmospheric, Oceanic, and Earth Sciences, & Center for Ocean-Land-Atmospheric Sciences George
This event has passed. View the seminar recording here: Prof. Aditi Sheshadri Department of Earth System Science Stanford University Monday April 4, 2022, 2 PM