Tag: Hydrology and Land Surface Processes

Figure A

Machine Learning-Based Estimation of Tropical Cyclone Intensity from Advanced Technology Microwave Sounder Using a U-Net Algorithm

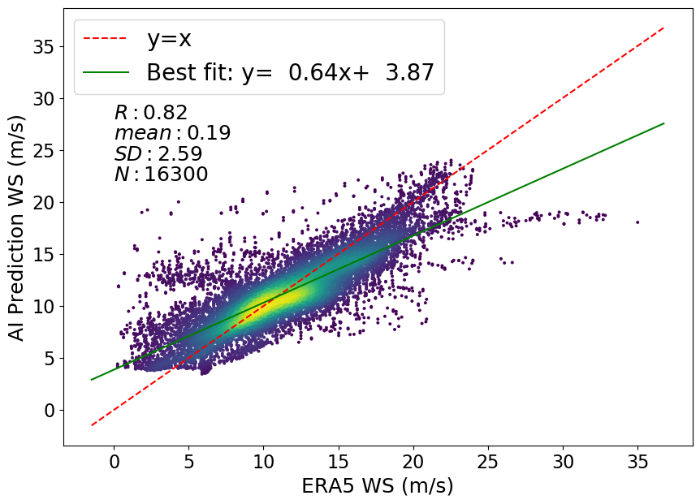
ESSIC/CISESS scientists Yong-Keun Lee and Christopher Grassotti are co-authors on a new paper in Remote Sensing led by first author Zichao Liang, a student who interned with the MiRS team during the summer of 2023. NOAA scientists Lin Lin and Quanhua Liu also co-authored the paper. The paper, titled “Machine Learning-Based Estimation of Tropical Cyclone Intensity from Advanced Technology Microwave Sounder Using a U-Net Algorithm”, assesses the use of the U-Net model to estimate surface wind speed and surface pressure over pure ocean conditions.

Read More »
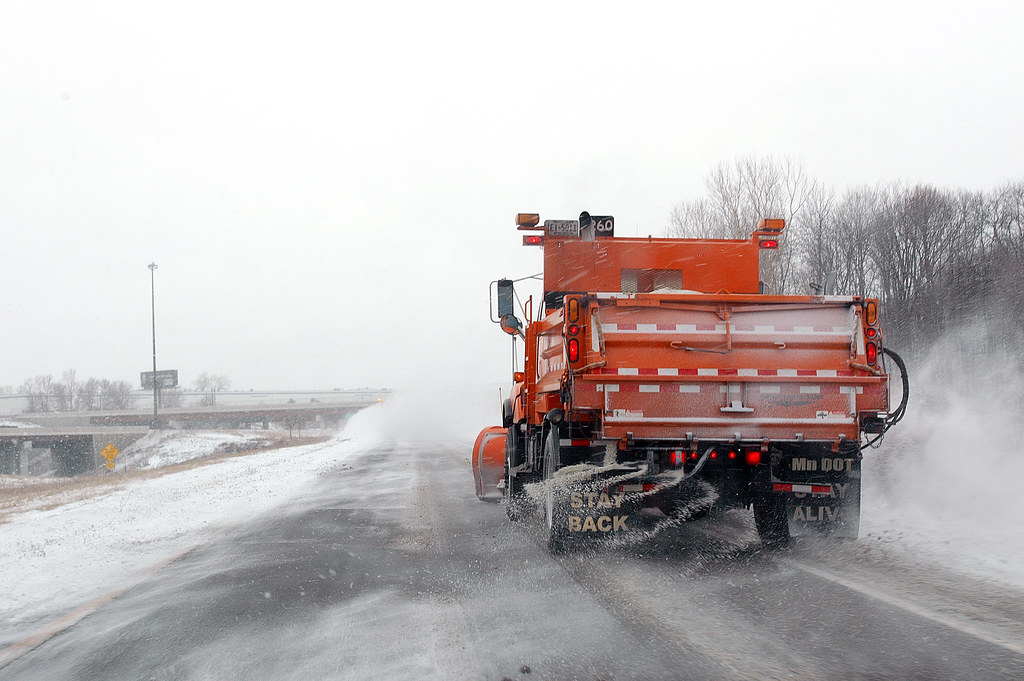
Photo by David R. Gonzalez of the Minnesota Department of Transportation

Sujay Kaushal Hosts Reddit Ask Me Anything

ESSIC scientist Sujay Kaushal and Ph.D. candidate Sydney Shelton hosted an “Ask Me Anything” (AMA) thread on Reddit on the /r/askscience subreddit. For two and a half hours, Kaushal and Shelton answered questions from the public regarding salinization and its impact on our planet.

Read More »
SatERR is a bottom-up approach, where the four types of errors including measurement, preprocessing, observation operator, and representativeness errors are generated from sources and forward propagate through radiances, science products, and data assimilation systems. This approach can quantify and partition errors and uncertainties in science products, and capture leading features of the most important errors in a statistical sense for data assimilation.

Leveraging Satellite Observations with a Comprehensive Simulator

Satellite observations are vital for weather forecasts, climate monitoring, and environmental studies. In recent years, there has been a concerted effort to develop methods for quantifying and representing errors associated with satellite observations. ESSIC scientist John Xun Yang has led a team of scientists in the creation of an error inventory simulator, the Satellite Error Representation and Realization (SatERR).

Read More »
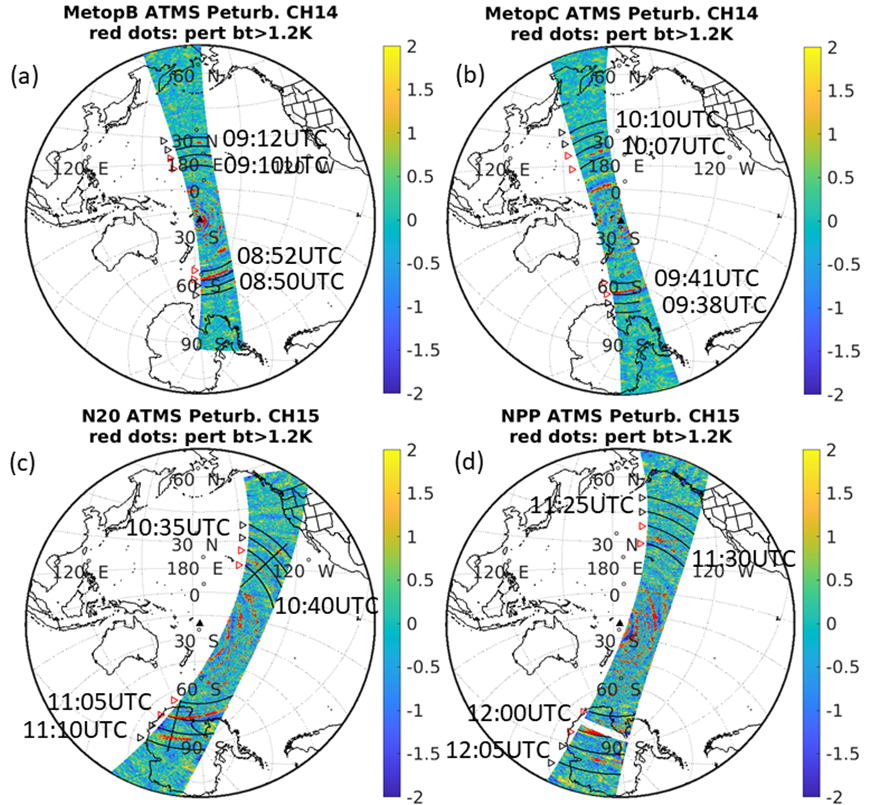
Figure 1. The local perturbations in observed microwave brightness temperatures from an ascending orbit of (a) MetOp-B AMSU-A channel 14, (b) MetOp-C AMSU-A channel 14, a descending orbit of (c) NOAA-20 ATMS channel 15, and (d) SNPP ATMS channel 15 on January 15, 2022. The black triangle at the center for each panel is the Tonga volcano location. The outermost black-curved lines from the Tonga volcano location correspond to a phase speed of 330 m/s assuming that the perturbation has been generated at the time and location of initial volcanic eruption. From the 2nd outermost black-curved lines to the innermost lines, the phase speeds are 300, 270, and 230 m/s, respectively. The time information in each panel indicates the approximate observation time for the Lamb wave (between 300 m/s and 330 m/s indicated by black right-pointing triangles) and for the lead gravity wave (between 230 m/s and 270 m/s indicated by red right-pointing triangles). Red dots indicate the pixels where the brightness temperature perturbation is larger than 1.2 K.

Satellite Microwave Observations of the Hunga Tonga Eruption’s Atmospheric Waves

ESSIC/CISESS scientists Yong-Keun Lee and Christopher Grassotti are authors on a new paper in Geophysical Research Letters describing the first attempt to perform a detailed analysis of the stratospheric impact of the eruption from satellite microwave observations. The other authors on the paper are Neil Hindley from University of Bath and Quanhua (Mark) Liu from NOAA’s Center for Satellite Applications and Research.

Read More »
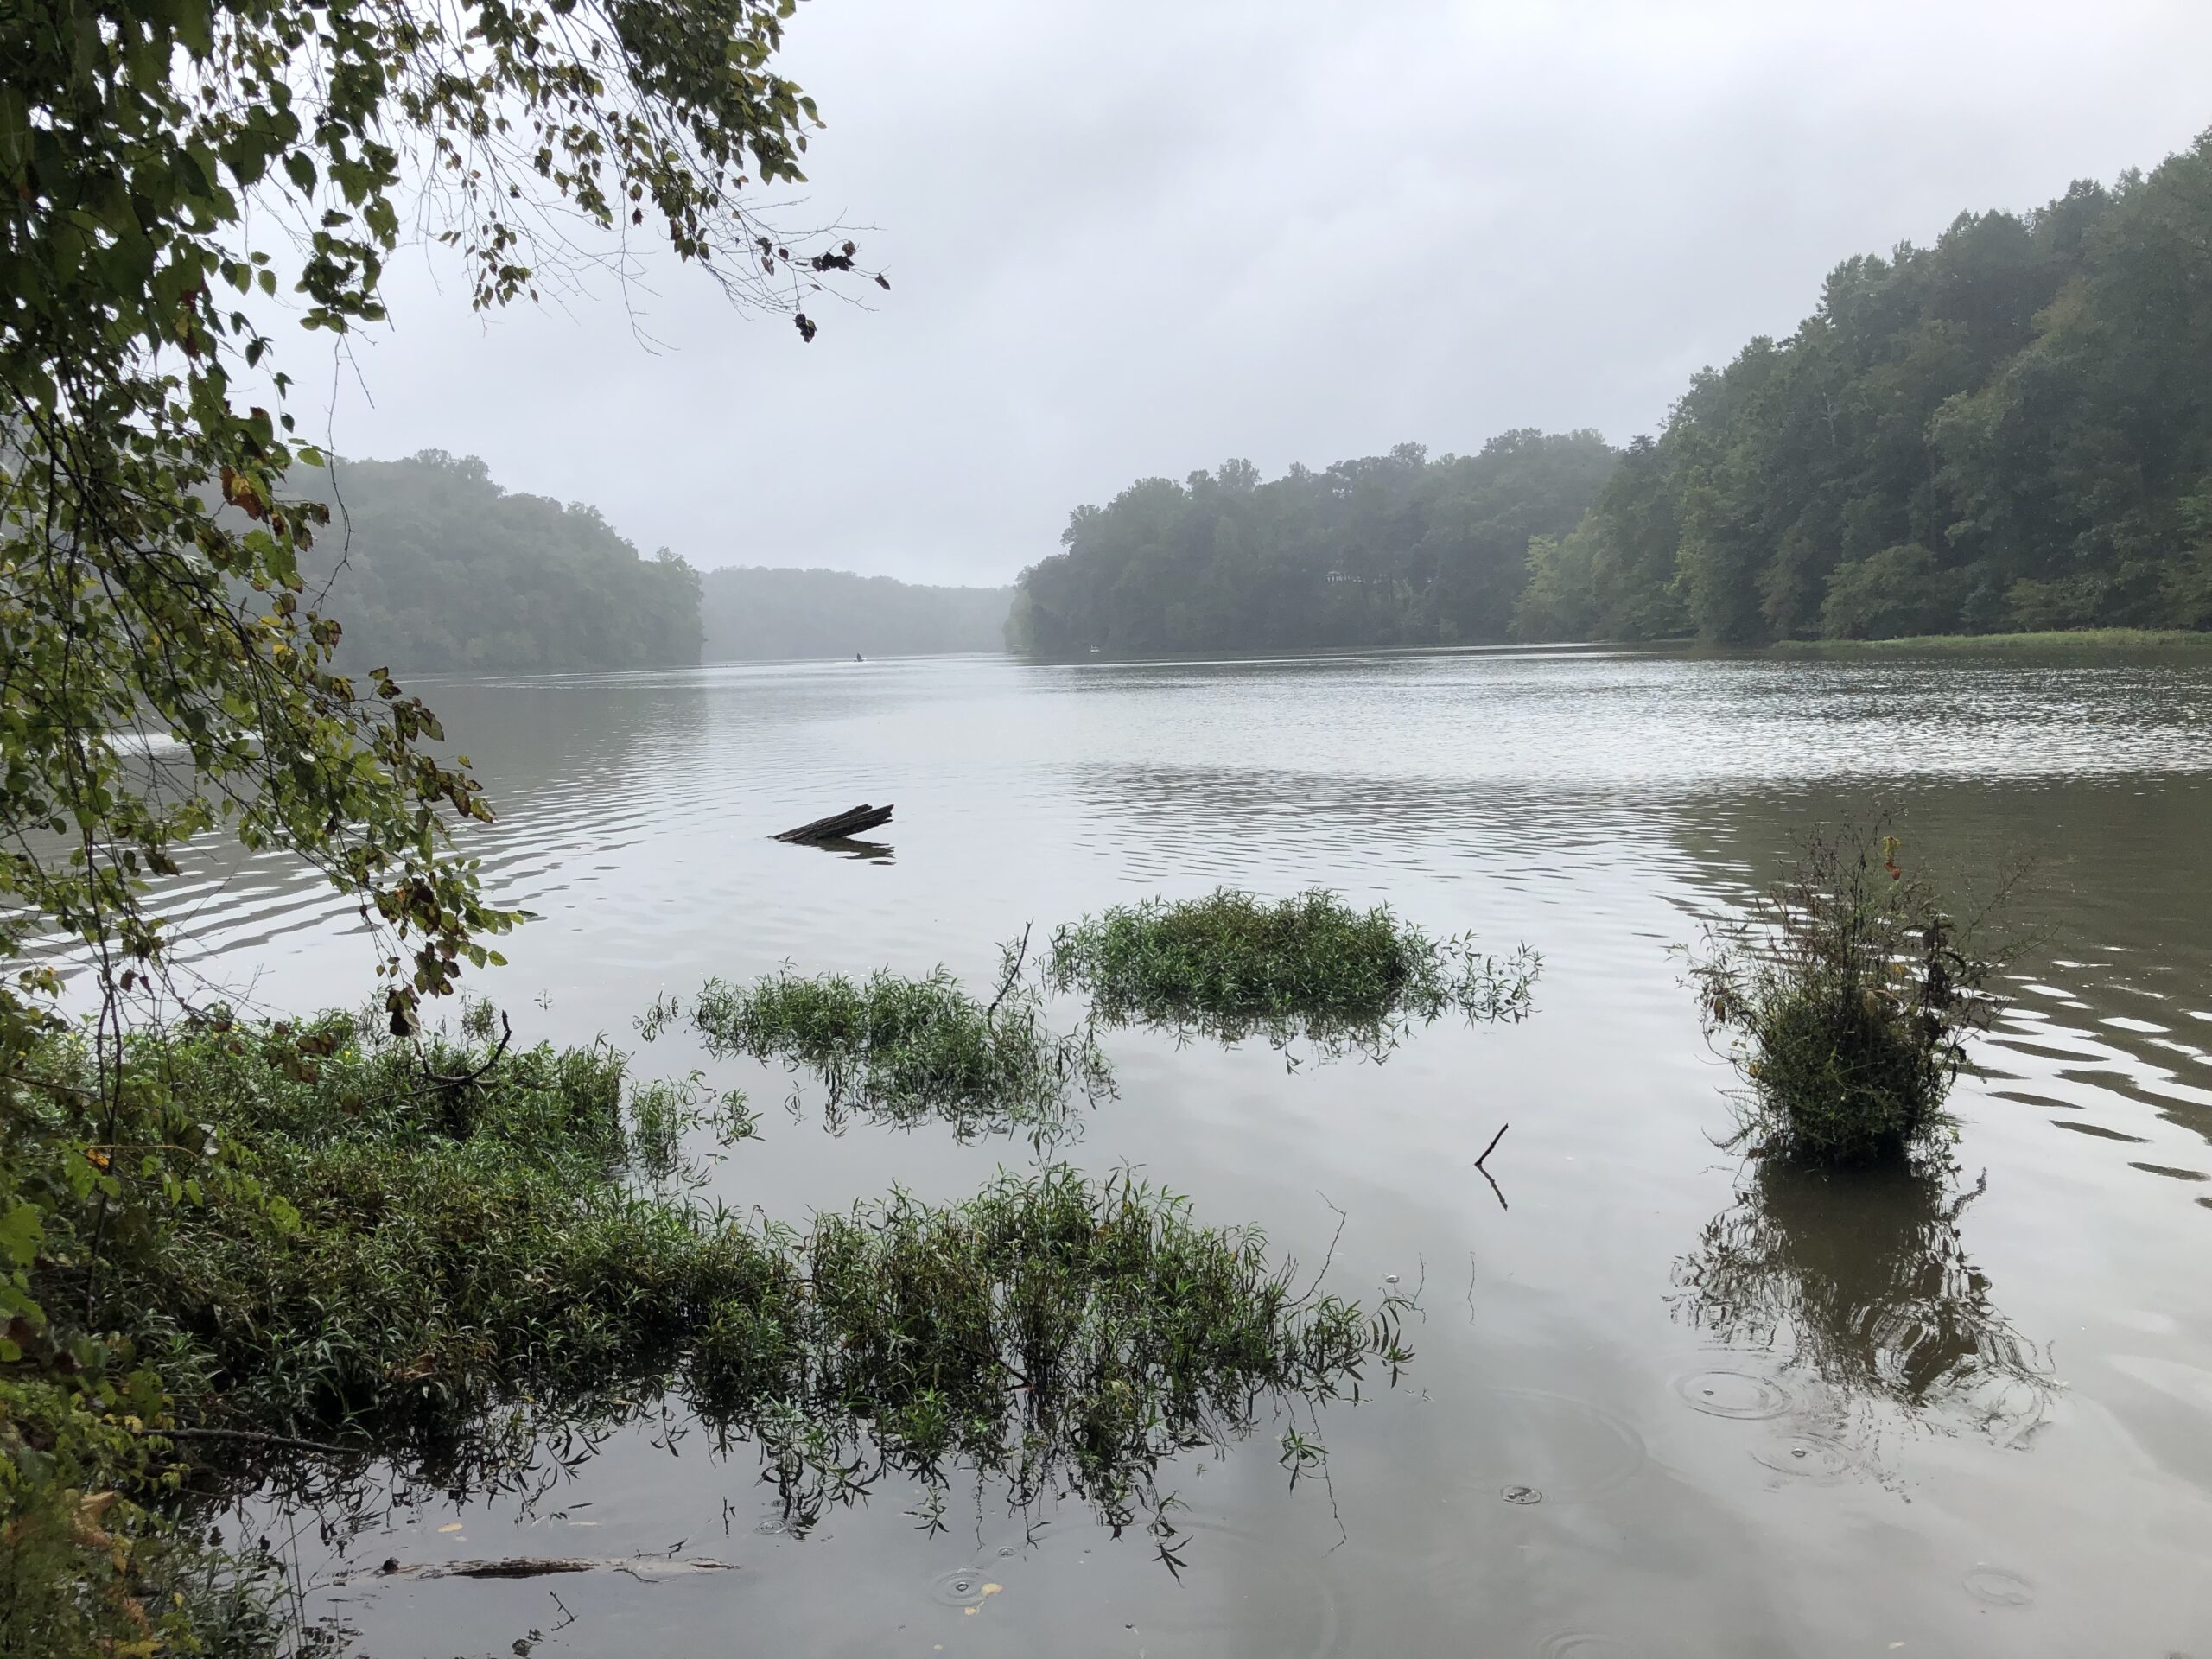
Bull Run flows into Occoquan Drinking water reservoir (Photo by Sujay Kaushal)

A New Way to Monitor Water Quality

A new study led by Earth System Science Interdisciplinary Center (ESSIC) scientist Sujay Kaushal introduces a new way to think about water quality monitoring along urban streams that could help researchers more accurately track pollutants across waterways.

Read More »