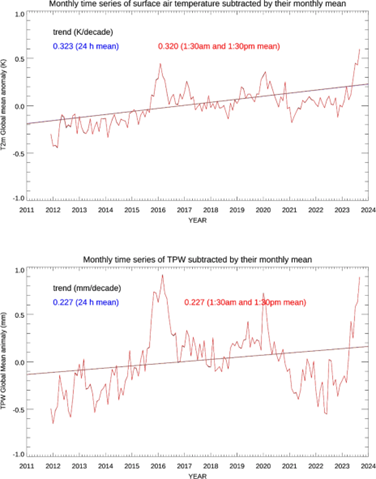
Trends in Temperature, Water Vapor and Surface Pressure: Signals of Climate Change and Atmospheric CO2 Increases
ESSIC/CISESS scientists Yan Zhou, Chris Grassotti, Yong-Keun Lee, and John Xun Yang are co-authors on a new paper in Scientific Reports titled “Trends of temperature

![Figure 3. Monthly TPW anomaly time series shown in red for ERA5 and blue for MiRS SNPP, 2012-2021. The straight lines are the linear regression fits. [a] is for global, [b] for Tropics, and [c] for mid-latitude regions, respectively.](https://essic.umd.edu/wp-content/uploads/2024/11/grassotti-zhou.png)

