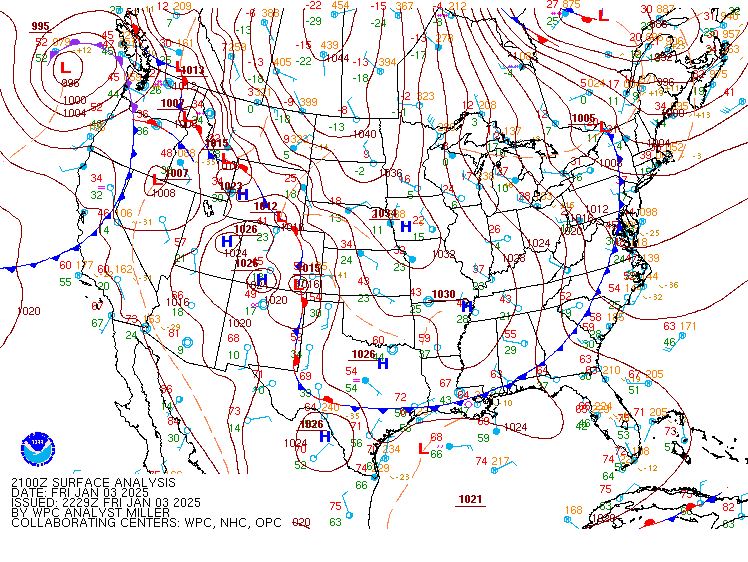
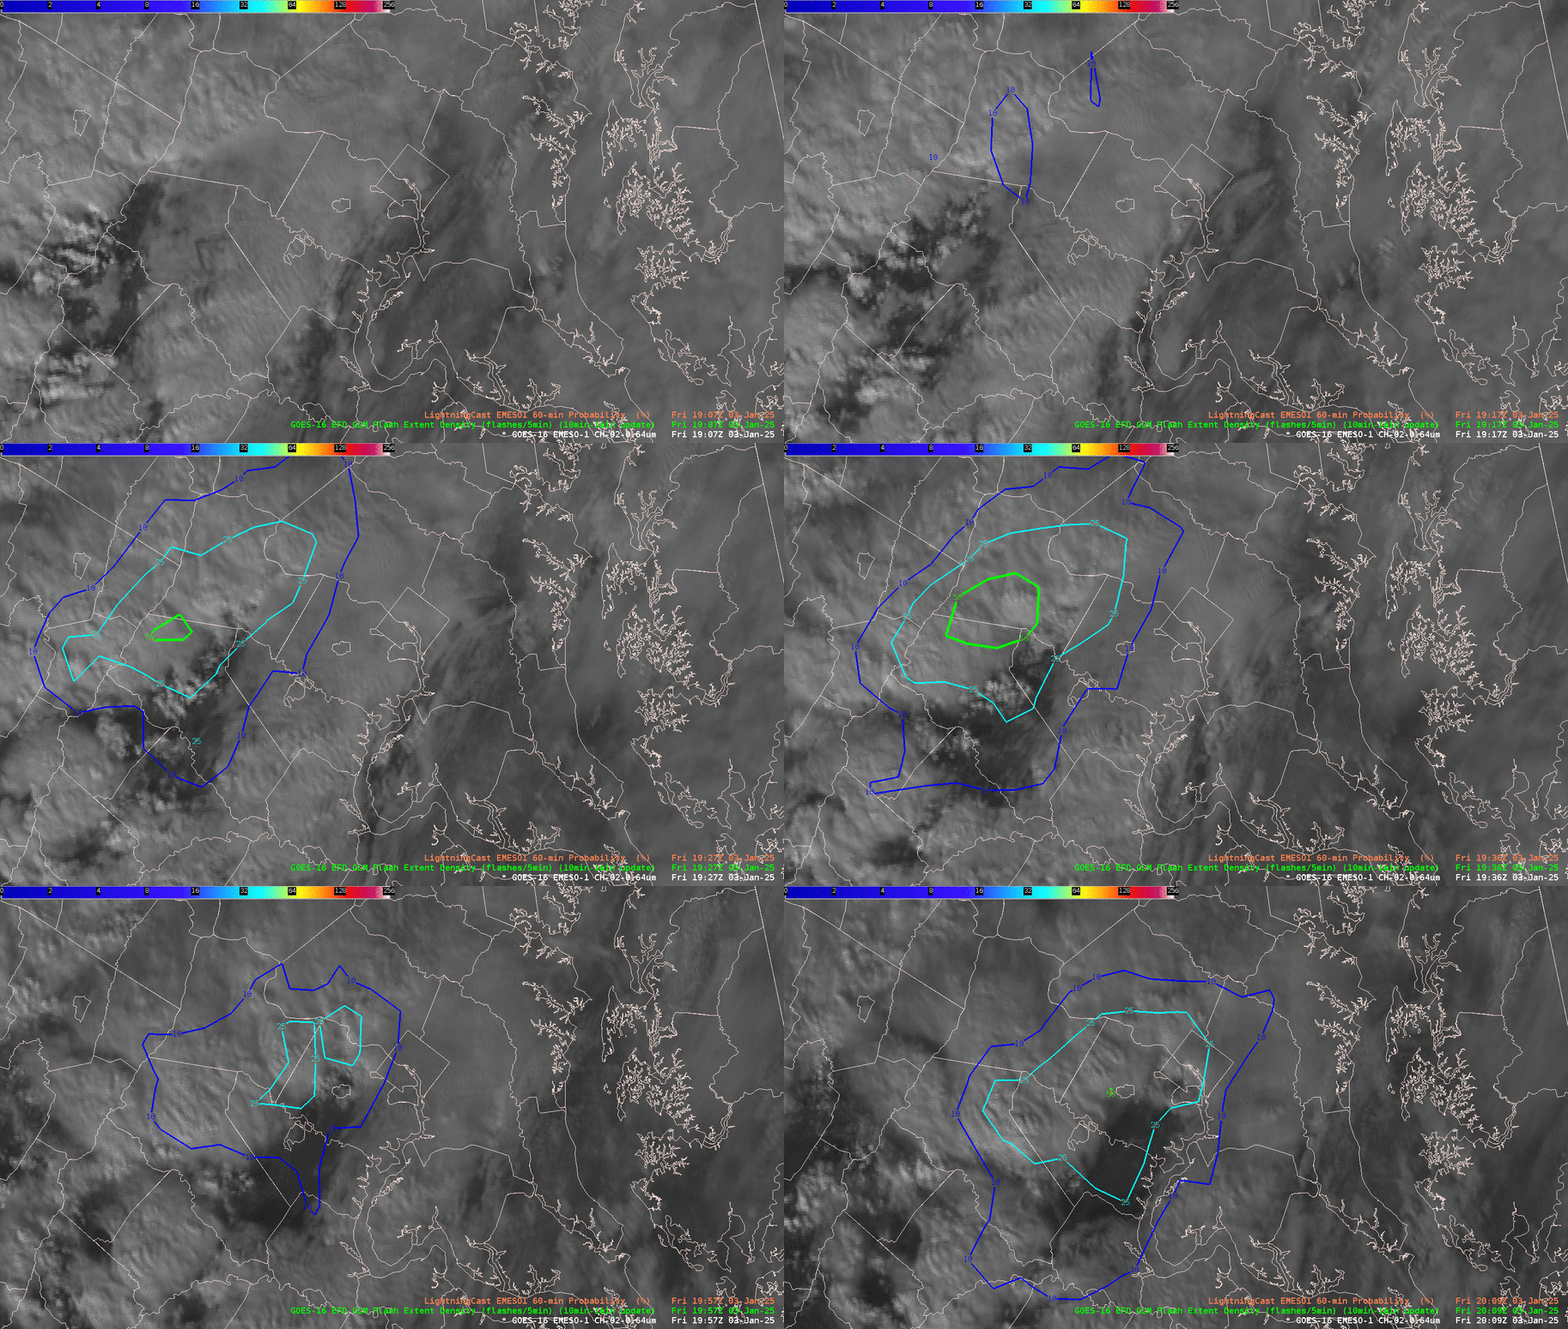
Shortly after the calendar flipped to 2025, much of the nation that had not yet seen much snow was blanketed with powder. An arctic air mass poured into the eastern half of the country on 03 January 2025, setting the stage for accumulating snow. As the potent cold front pushed towards the Eastern Seaboard, it did so in dramatic fashion, firing off snow squalls that delivered thundersnow, including in the nation’s capital. NWS Sterling issued a Snow Squall Warning for Washington, D.C. at 2027 UTC 03 January 2025, noting “Dangerous and life-threatening travel conditions…in the warning area.”. Leading up to the issuance of the warning, GOES-East LightningCast provided ample lead time before the GLM Flash Extent Density (FED) observed lightning around ~2000 UTC 03 January 2025, with 25-50% contours west of D.C. for about an hour.
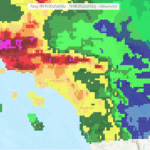
The snow squalls on 03 January were just a preview of what was to come for much of the nation as a larger snowstorm was set to unfold in the following days. The system was forecast well in advance, and the NWS WPC Winter Storm Severity Index (WSSI) highlighted major impacts, stretching from Kansas to Kentucky, from 1200 UTC 03 January to 0600 UTC 06 January 2025.

The system first moved into the Western U.S. as a strong upper-level trough pushed ashore on 03 January 2025. GOES-West Full Disk Mid-Level Water Vapor Band 9 imagery showed the trough and associated surface low spinning towards the Oregon Coast from ~0930 to ~1930 UTC 03 January 2025.

Thundersnow on 05 January in Kansas and Missouri was forecast as a possibility in the WPC Probabilistic Heavy Snow and Icing Discussion, issued at 1927 UTC 03 January 2025: “KS/MO…potential for thundersnow (through CI) and snowfall rates of 2+”/hr.” The forecast indeed verified with the GOES-East GLM FED showing ample lightning across the eastern Plains and Mid-Mississippi Valley, including Kansas and Missouri where snow was falling, from ~0400 to ~1600 UTC 05 January 2025.

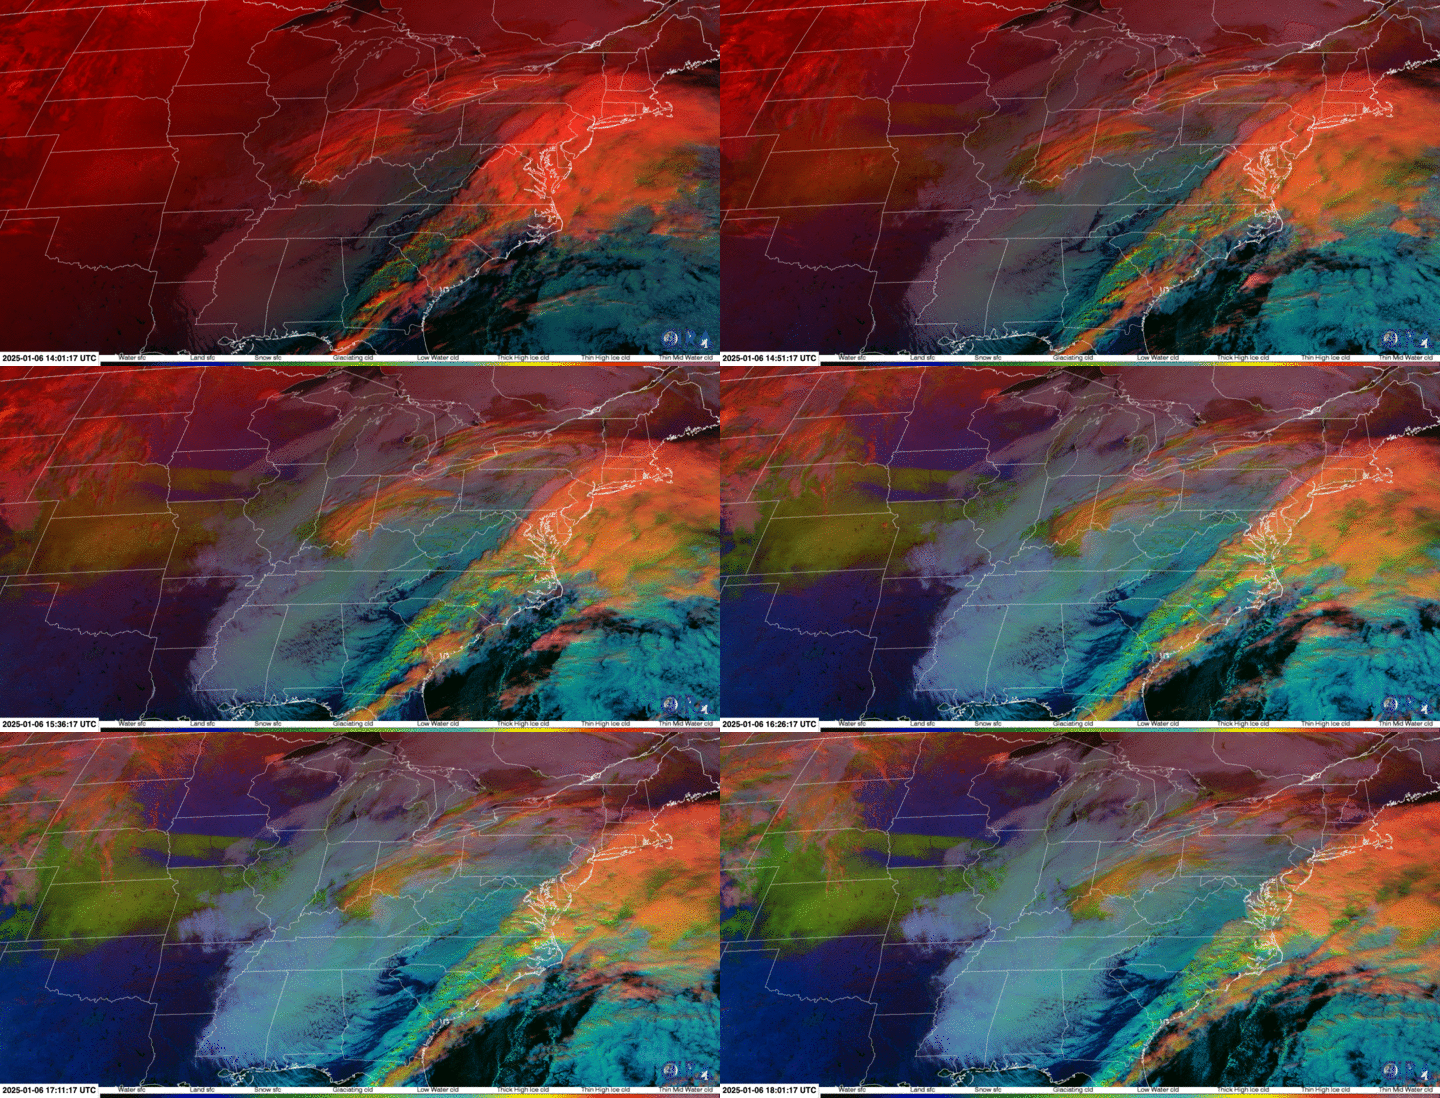
The snow spread east to start the workweek on 06 January, bringing snow again to Washington, D.C., as well as Baltimore and Philadelphia. GOES-East Day Cloud Phase Distinction RGB imagery from ~1400 to ~1800 UTC 06 January 2025 provided a look at where there was fresh snow cover as the sun rose, with bright green colors across much of the Central Plains and Mid Mississippi Valley. In addition, it was easy to tell with the RGB where snow was still falling, with orange, yellow, and light green colors signaling glaciation in the cloud cover, first right along the Mid-Atlantic Coast where there was a developing area of low pressure, and a second area further west in the Ohio Valley where there was an upper-level low.
GOES-East GeoColor imagery on 07 January 2025 showed the Mid-Atlantic blanketed in white with fresh snow cover from southern Virginia to New Jersey. You’ll notice minimal movement in the snowpack as cold temperatures limited melting.
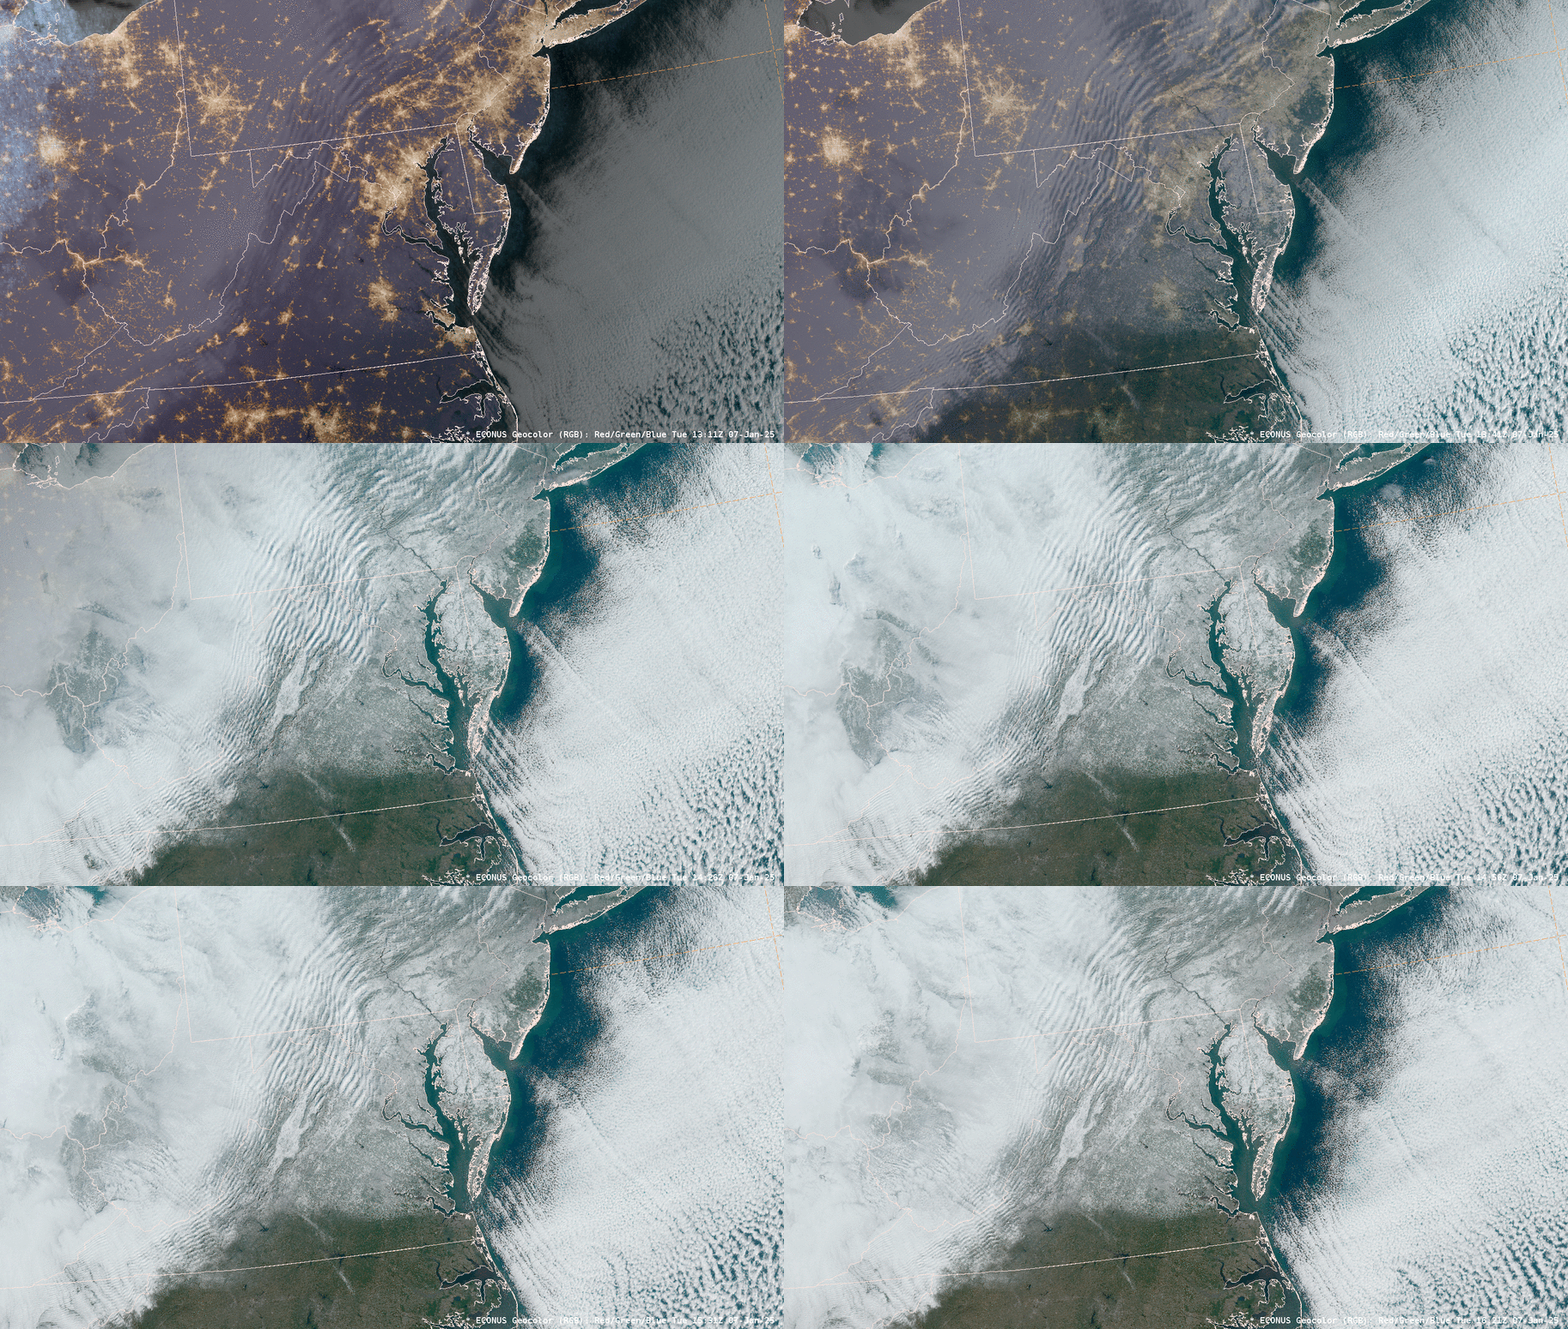
According to the NWS WPC Storm Summary issued at 1500 UTC 07 January 2025, Washington, D.C., received 8.3 inches of snow from the system, while six states recorded a foot or more of snow: Delaware, Indiana, Kansas, Maryland, Missouri, and Nebraska. In addition, freezing rain ice amounts reached 0.75″ in Kentucky and Virginia.


