Summer is in full swing, and high humidity and hot temperatures have fueled repeating rounds of storms across much of the East, including the Mid-Atlantic for the first day of July. The NWS Weather Prediction Center issued a targeted Moderate Risk Excessive Rainfall Outlook (ERO) on 1 July 2025, highlighting the risk of flash flooding for the urban areas of Washington, D.C., Baltimore, and Philadelphia. The heightened potential for flash flooding was backed by high precipitable water with ‘a robust 2.07″ PWAT, a daily record for 7/1’ on the 1200 UTC sounding from Dulles, VA, as mentioned in the Excessive Rainfall Discussion. In combination with the high moisture, there was plenty of ‘lift’ support from an approaching cold front to yield heavy rainfall.


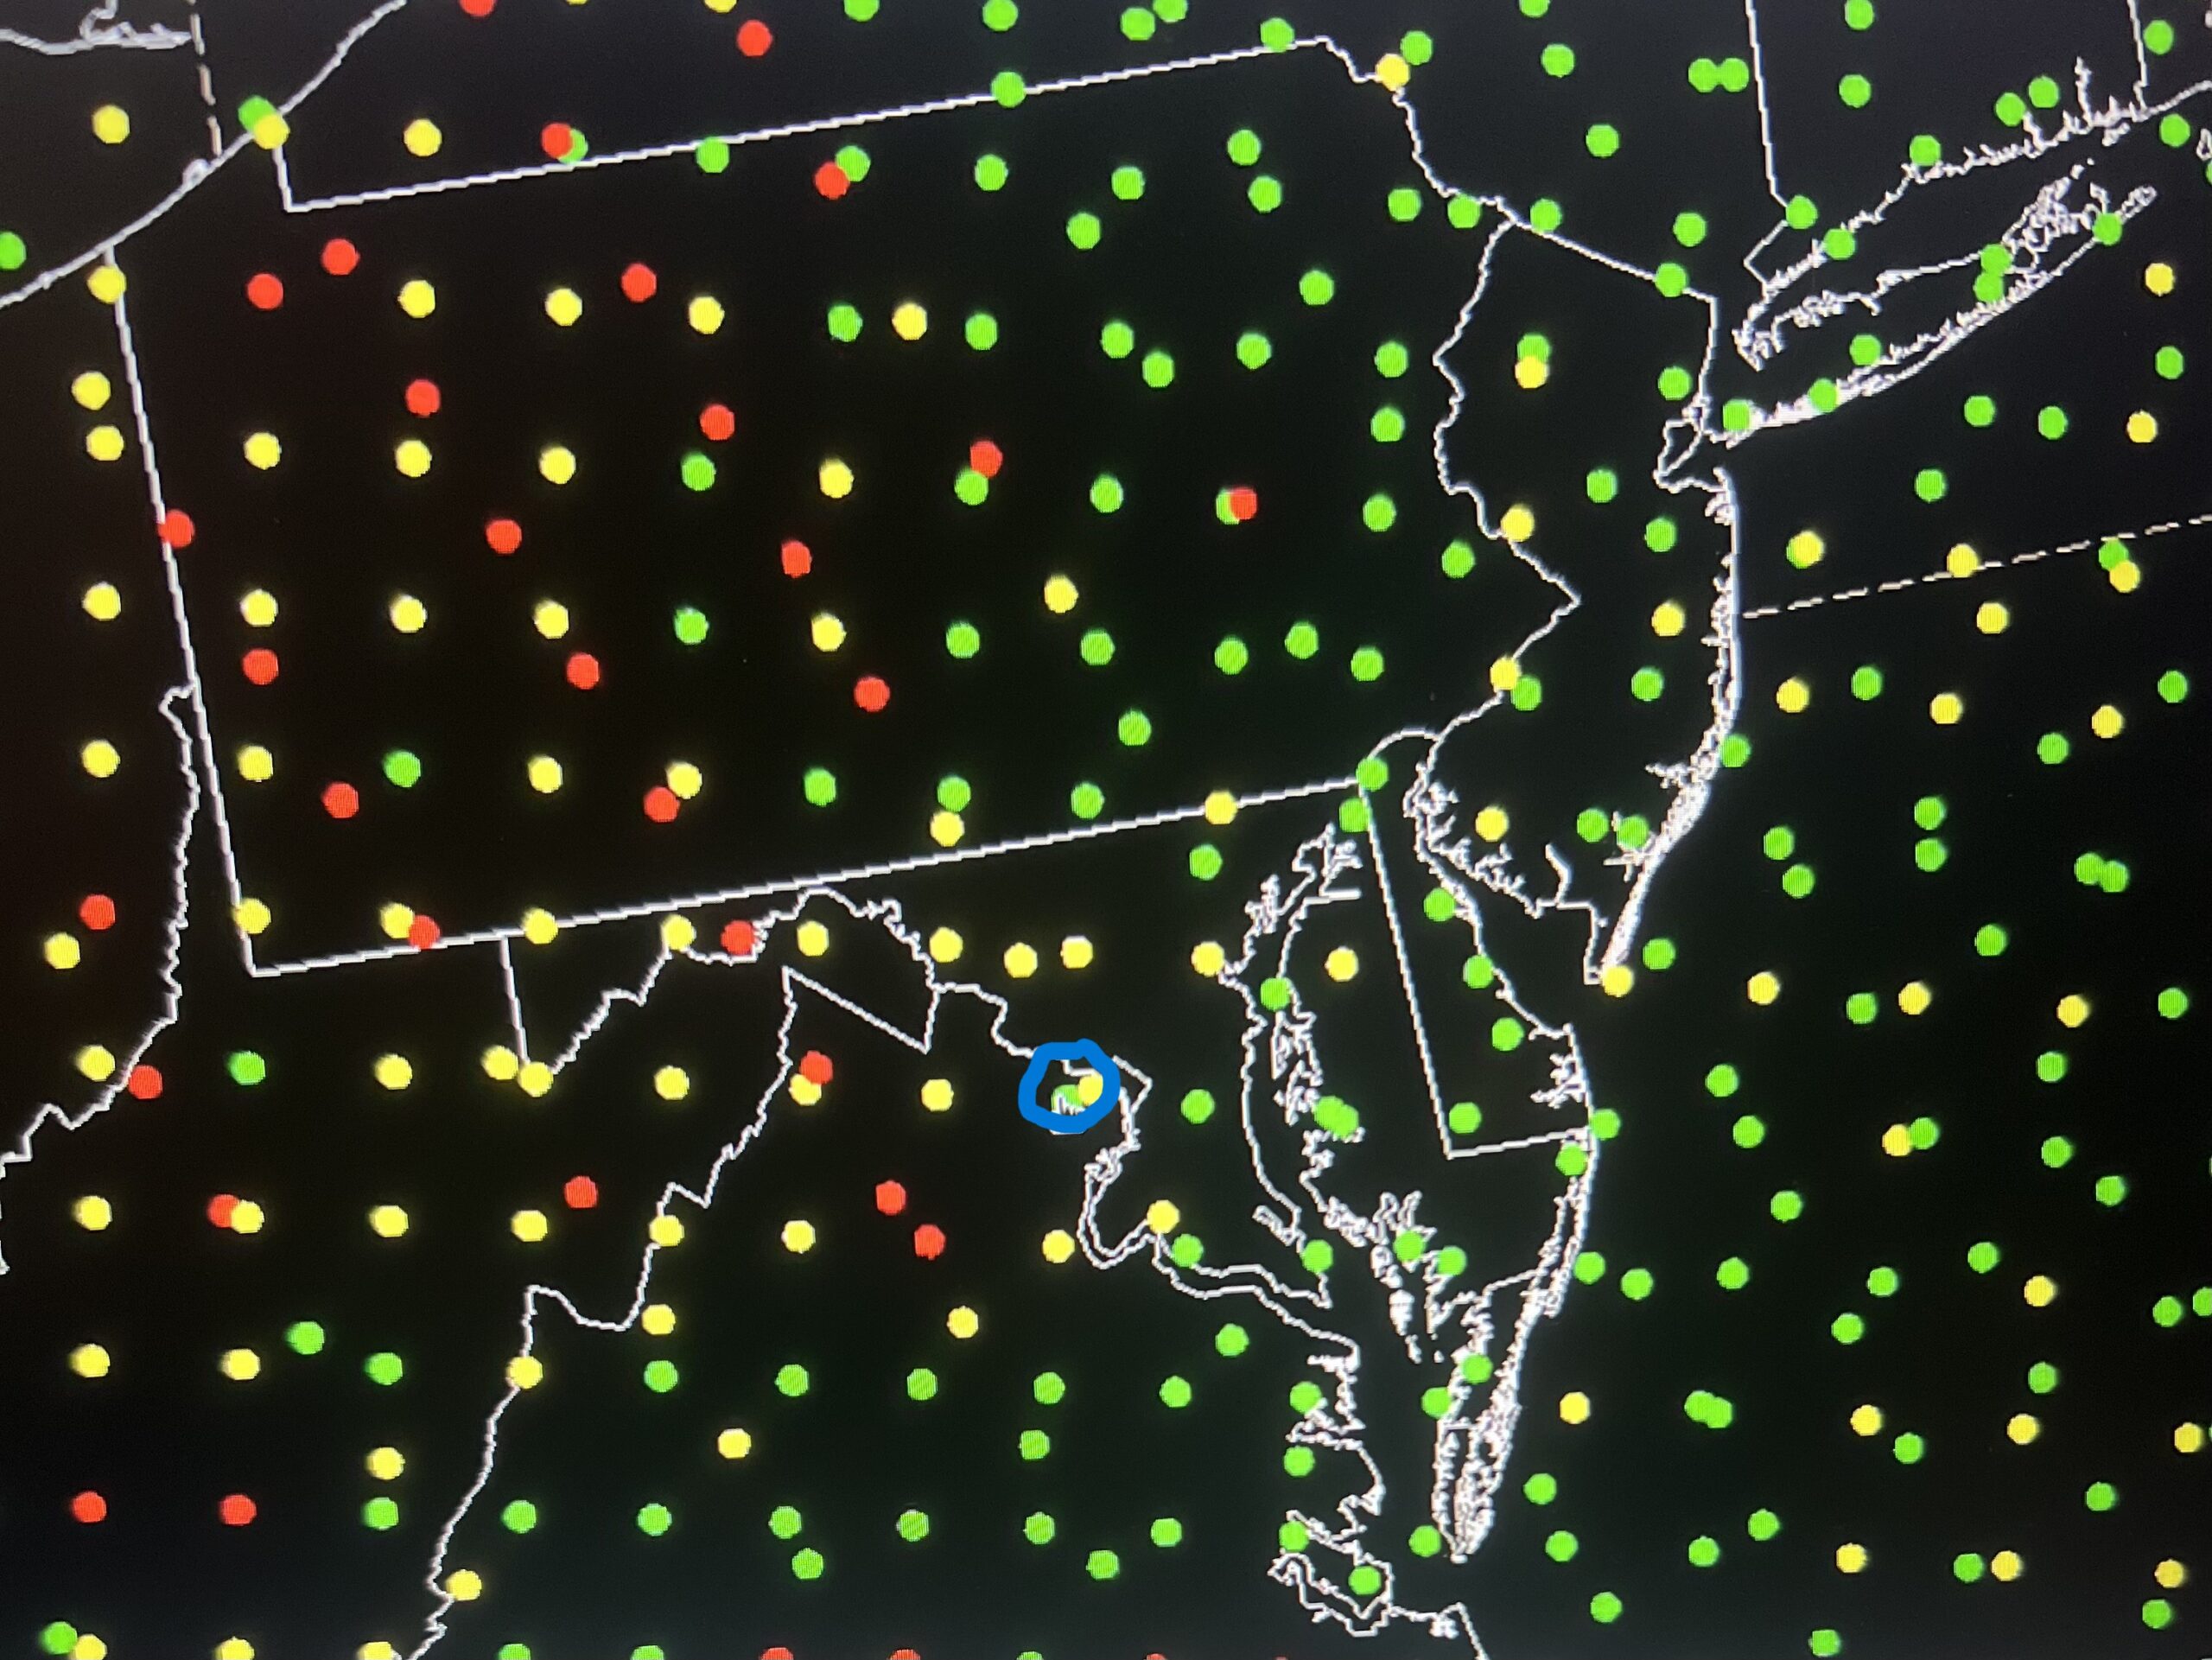
A NOAA-Unique Combined Atmospheric Processing System (NUCAPS) Sounding, with inputs from NOAA-20, NOAA-21, and Metop-C, at the circled location around ~1500 UTC 01 July 2025 already indicated high levels of instability, with Most Unstable CAPE (MUCAPE) exceeding 1500 J/kg.

Additionally, the NESDIS/Office of Satellite and Product Operations (OSPO) Advected Layered Precipitable Water (ALPW) product from ~2000 UTC 30 June to ~2000 UTC 01 July 2025 depicted high levels of moisture all the way up to the 700-500 hPa layer, pumping up the Eastern Seaboard. When summing all four layers, PW values exceeded 1.8″ in Central Maryland at 1800 UTC 01 July 2025, not far off from the 2.07″ PWAT observed 6 hours earlier in Dulles, VA.


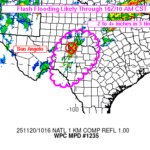
Just after Noon Eastern on 1 July, a Mesoscale Precipitation Discussion (MPD) was issued by the WPC Met Watch Desk, noting ‘Numerous instances of flash flooding are likely’ as ‘GOES-EAST WV-ML highlights a disturbance off the Southeast coastline which is helping to squeeze mid-to-upper level moisture transport towards the central Appalachians and Mid-Atlantic.’…’Southeast PA in particular is extremely susceptible to these intense rainfall rates as 1-hr FFG in the area is below 1″, after the area received several inches of rain on 30 Jun 2025. GOES-East Mid-Level Water Vapor Band 9 showed the moisture in the Mid-Atlantic and the upper-level trough rotating off the Southeast Coast.
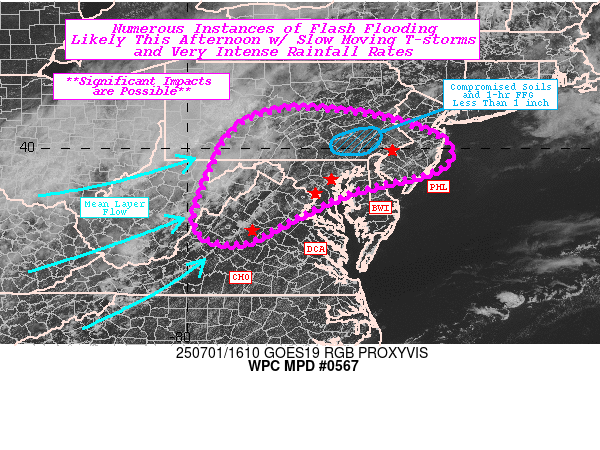
Figure 8: GOES-East Mid-Level Water Vapor from ~1020 to ~2010 UTC 01 July 2025. This video was created from AWIPS, and display files can be shared upon request.
The GOES-East Split Window Product uses the difference between the Band 13 Clean Infrared (IR) Longwave (LW) Band and the Band 15 “Dirty” LW Band to detect low-level moisture. If the Split Window Difference (SWD) is positive, or Band 15 is colder than Band 13, that’s because Band 15 absorbs low-level water vapor. The colorbar in the animation below adopted a similar technique as shown in Kris White’s May 2024 Satellite Book Club, with the scale shifted to account for high positive SWD values due to the extremely moist air mass in place. You can see prior to convective initation, much of Central Maryland, DC, and northern Virginia become bright green (high SWD), indicating pooling of low-level moisture.
Figure 9: GOES-East SWD Product, overlaid on Visible Band 02 from 1301 to 1936 UTC 01 July 2025. This video was created from AWIPS, and display files can be shared upon request.
In addition to the threat for flooding for the Mid-Atlantic, the NWS Storm Prediction Center (SPC) had issued a Slight Risk for severe thunderstorms on 01 July 2025, with the main threat being damaging wind gusts in excess of ~60 mph. The GOES-East LightningCast product provided ~30 minutes of lead time before lightning was detected by the GLM Flash Extent Density (FED) product across central Virginia.
Figure 10: 1-minute Mesoscale GOES-East LightningCast output, overlaid on the Day Cloud Phase Distinction RGB from ~1445 to ~1605 UTC 01 July 2025. This video was created from AWIPS, and display files can be shared upon request.
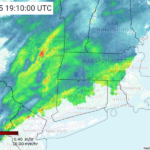
The GOES Radar Estimation via Machine Learning to Inform NWP (GREMLIN) Product was recently made available in AWIPS at WPC. Full Disk 10-minute output at 1750 UTC 01 July 2025 showed a few intense cells in northern Virginia, matching fairly well with ground-based radar. These intense cells are collocated where the GLM FED detected higher amounts of lightning, as GLM was a training input to the machine-learning for GREMLIN. GREMLIN is not meant to replace or improve upon ground-based radar, but is useful for areas with well-known beam blockages or gaps in radar coverage. You can see in the radar output west-northwest of Washington, D.C., the two leading lines of storms are split, while GREMLIN has higher radar reflectivities between the lines where GLM FED is detecting lightning. The GREMLIN output may add value in this case, as the radar for the region is located in Dulles, VA, and may miss some reflectivities in its direct vicinity.


