")
Headlines:
- La Nina signal remains evident in rainfall anomalies across much of tropics
- Flooding in northwest U.S. from atmospheric rivers
- Intense rain events and flooding in Middle East
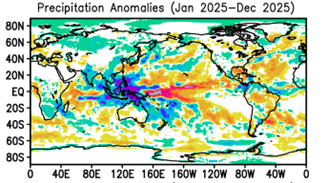
- Early look at annual 2025 anomaly map shows it was a La Nina year. (2025 Annual Precipitation Report out soon)
The SST pattern across the tropical central and eastern Pacific Ocean remains on the La Nina side in December with negative surface temperature anomalies reducing the available moisture for rainfall in the region. The Nino 3.4 Index was -0.6K for December and the Relative 3.4 Index was -1.0K, both about the same as last month. This SST pattern helps to shift the Walker Circulation so that anomalous descent is concentrated around the Equator at ~180° longitude.
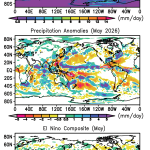
The December mean precipitation map (Fig. 1, top panel) shows the southward seasonal shift of the tropical rain areas over the continents and more subtle shifts in the oceans. The Northern Hemisphere ocean storm tracks are also evident, extending into the western ends of the continents, and in the Southern Hemisphere the sub-tropical to mid-latitude streaks off of southern Africa, Australia to Mid-Pacific, and South America are evident. And far to the south the circum-polar feature at ~50° S is continuous with variations in intensity, width, etc.
The December precipitation anomaly map (Fig.1, middle panel) has the typical La Nina features of a strong negative feature at around 180° longitude with a negative extension in a shallow arc to the east to the South American coast. To the west there is a broad, very variable positive feature over the Maritime Continent and extending into northern Australia. Both of these features are obvious in the La Nina composite for December (Fig. 1, bottom panel). The positive December anomaly area was also related to some heavy rain events and flooding in Indonesia and Brunei, with also a little flooding occurring in northeast Australia.
To the west the eastern Indian Ocean is mostly positive with tropical cyclones traversing parts of the southern Indian Ocean, with TC Grant leaving a narrow trail across the anomaly map headed westward from northwest of Australia. Southern Africa is covered mostly with a positive anomalies with associated flooding in Mozambique and Tanzania, with an extension to the southeastward far into the ocean. These features also appear in the La Nina composite.
Across the mid-latitude Pacific an extension of the Maritime Continent anomaly feature weaves northeastward in a very variable fashion and intersects the west coast of North America. This feature was associated with multiple atmospheric rivers transporting tropical moisture into the west coast of the U.S. with significant floods in Washington and Oregon and mudslides burying cars in southern California. The December precipitation added to previous months so that the long-term drought over California is essentially over. And much further up the coast very heavy, anomalous snows in Juneau, Alaska collapsed roofs and sank boats in the harbor. This pattern also fits with the La Nina composite as does the this month’s negative anomaly from Mexico to the eastern U.S. In South America the La Nina link is weaker, although the Atlantic ITCZ has a positive anomaly in both maps.
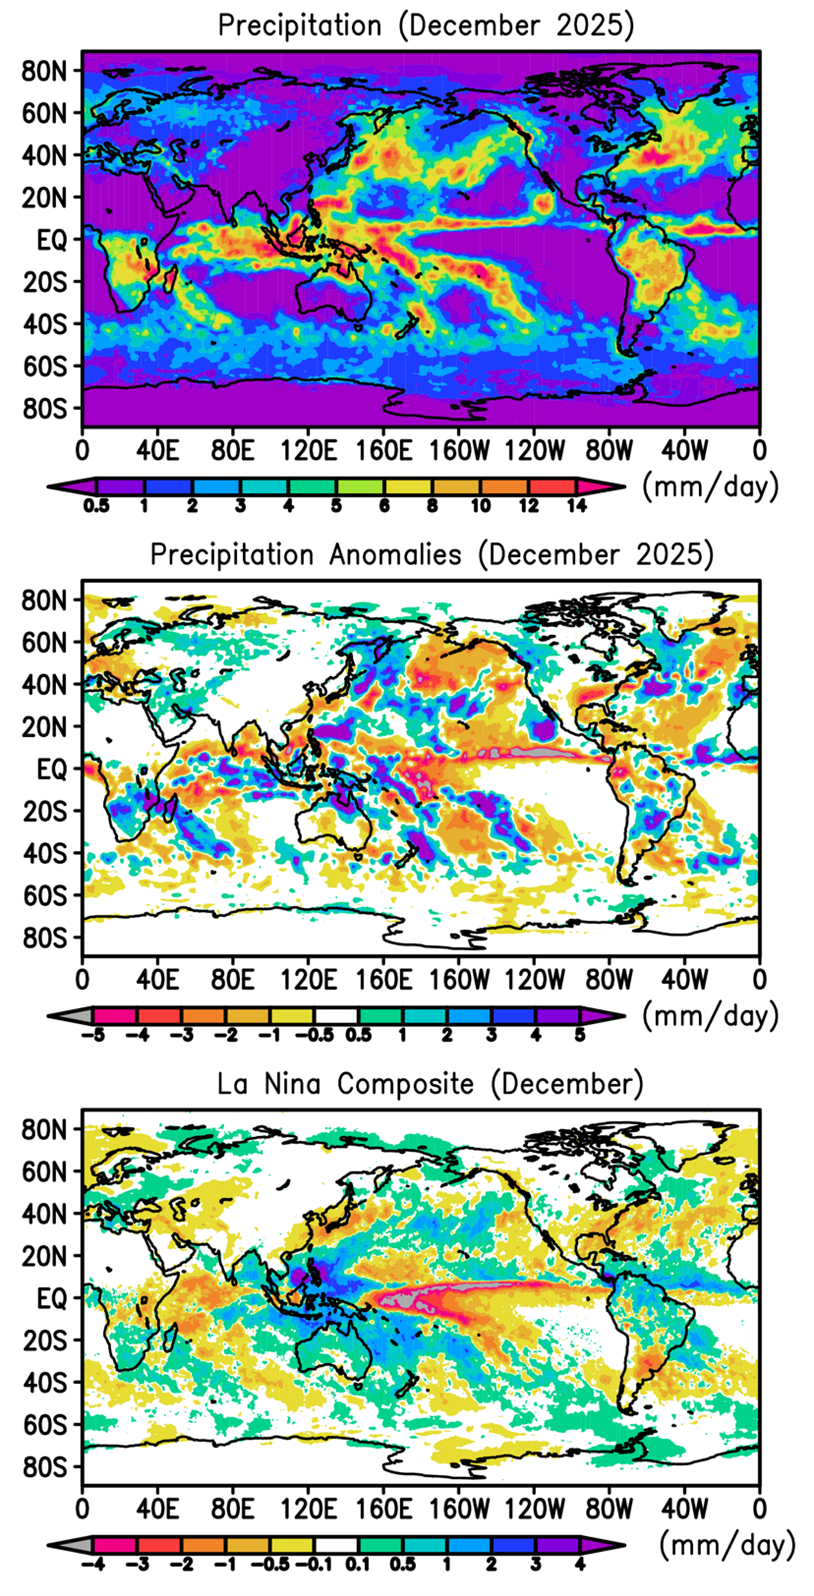
One place where the La Nina link is missing this month is the Middle East. Whereas last month (November) there was a dry anomaly over the area that fit the La Nina narrative, this month there was significant rainfall in Iraq and southern Iran with some flooding from weather systems crossing over from the Mediterranean, spurring a positive precipitation anomaly there. The refugee camps in Gaza were even affected, with 14 people dying in wintertime flooding there.
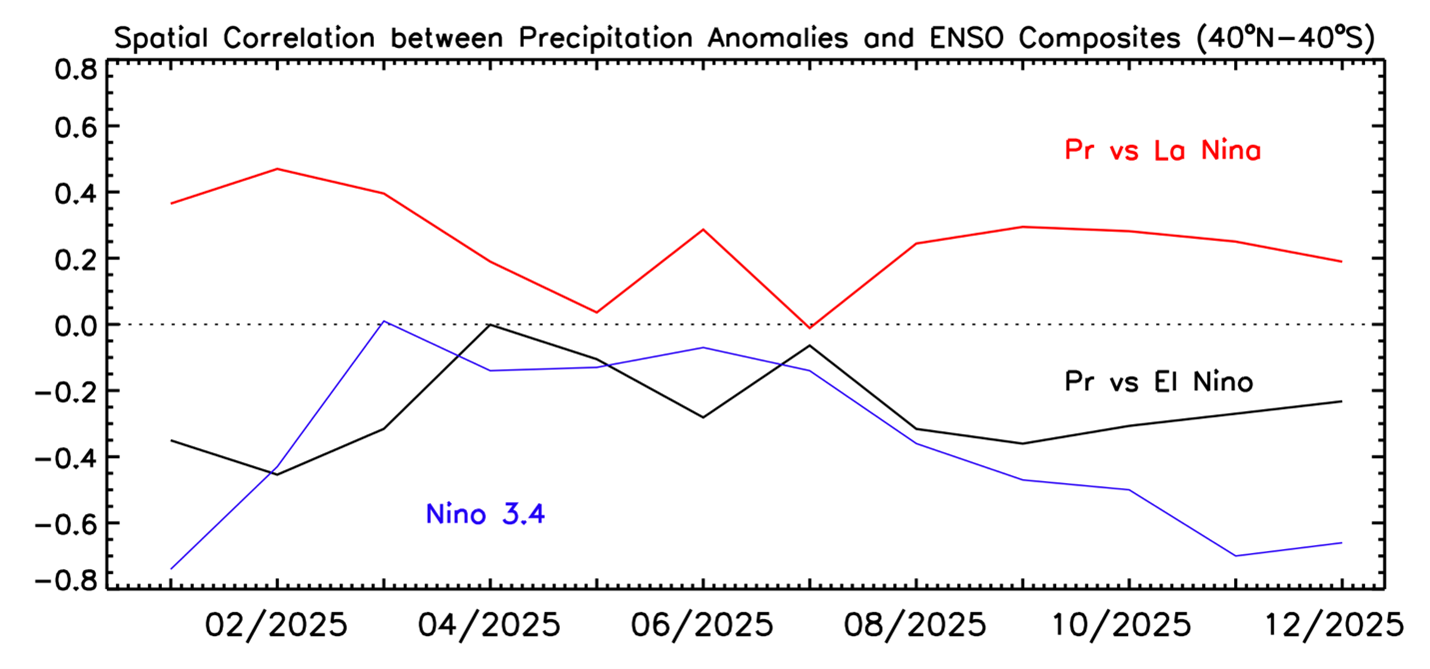
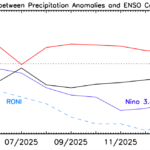
The spatial correlations in Fig. 2 again show December’s rain anomaly pattern correlated positively with the La Nina composite, as expected, but with only a weak correlation (~0.2). One can see the entire year of correlations in Fig. 2, which shows the La Nina pattern stronger in the early part of the year (correlation with La Nina composite higher).
Table 1 shows the global total precipitation right at the long-term mean, but with oceans higher and land lower, as expected in La Nina conditions.
Table 1: Global precipitation and anomalies in December 2025.
| Mean Precipitation (December 1983-2024) | Precipitation (December 2025) | Precipitation anomaly (December 2025) |
Land+ocean | 2.80 | 2.80 | 0.01 |
Land | 2.06 | 2.22 | 0.16 |
Ocean | 3.11 | 3.05 | -0.06 |
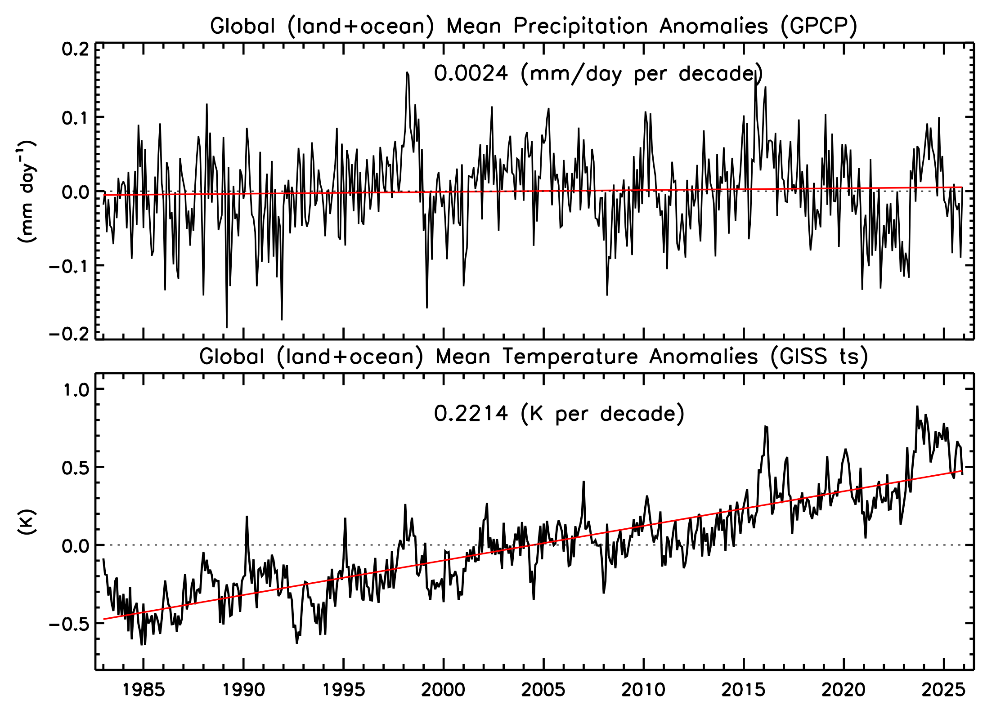
However, a glance at Fig. 3 shows a possibly interesting feature of the recent months (i.e., during 2025) in that while the monthly global precipitation number is below the mean (La Nina), the global surface temperature has remained above the fitted line that represents the global warming trend. Even though we have been in a (weak) La Nina, the planet’s surface temperature is above the trend curve, unlike in previous La Nina conditions in the diagram. Are we in a new global warming situation, when even in La Nina conditions the temperatures are near record highs?
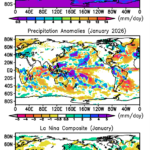
December completes 2025 and the anomaly map for the year is shown in Fig.4 and clearly indicates the La Nina signal for the year. Our global precipitation report for the 2025 year will be available in about a week.
The Global Precipitation Climatology Project (GPCP)
This global precipitation summary is based on V3.2 of the Monthly Global Precipitation Climatology Project (GPCP) product, an observation based analysis using satellite observations over oceans and satellite and rain gauge observations over land. The Monthly analysis extends from 1983 to the near present as a Climate Data Record (CDR) with an extension to the previous month (within ~ 12 days of the end of the month) as an Interim CDR, or ICDR.
The development of the GPCP CDR products (Monthly and finer time scales) is supported by NASA’s MEaSUREs program. The GPCP Monthly ICDR was developed and its routine calculation is supported by NOAA’s National Center for Environmental Information (NCEI). GPCP products are available at NASA’s Goddard Earth Sciences Data and Information Services Center (GES DISC) and from NOAA NCEI.
The following references describe GPCP products in detail and provide additional research results using GPCP by the authors of this summary:
GPCP V3.2 paper:
Huffman, G. J. and R. Adler, A. Behrangi, D. Bolvin, E. Nelkin, G.Gu and M. Ehsani, 2023. The New Version 3.2 Global Precipitation Climatology Project (GPCP) Monthly and Daily Precipitation Products. J. Climate, 36, 7635- 7655. DOI: 10.1175/JCLI-D-23-0123.1.
GPCP V2.3 paper:
Adler, R., M. Sapiano, G. Huffman, J. Wang, G. Gu, D. Bolvin, L. Chiu, U. Schneider, A. Becker, E. Nelkin, P. Xie, R. Ferraro, D. Shin, 2018. The Global Precipitation Climatology Project (GPCP) Monthly Analysis (New Version 2.3) and a Review of 2017 Global Precipitation. Atmosphere. 9(4), 138; doi:10.3390/atmos9040138
Other references:Adler, R., G. Gu, M. Sapiano, J. Wang, G. Huffman 2017. Global Precipitation: Means, Variations and Trends During the Satellite Era (1979-2014). Surveys in Geophysics 38: 679-699, doi:10.1007/s10712-017-9416-4 Adler, R. F., G. Gu, G. J. Huffman, R. P. Sapiano and J. Wang, 2020: GPCP and the Global Characteristics of Precipitation. In Satellite Precipitation Measurement, Vol. 2, Chapter 35, 677-697. Advances in Global Change Research, 69, Springer Nature, doi:10.1007/978-3-030-35798-6_11.
Gu, G., and R. Adler, 2023. Observed Variability and Trends in Global Precipitation During 1979-2020. Climate Dynamics, 61, 131-150.
Adler, R. and G. Gu, 2024. Global Precipitation for the Year 2023 and How It Relates to Longer Term Variations and Trends. Atmosphere, 15(5). 10.3390/atmos15050535.
Gu, G. and R. Adler, 2024. Variability and Trends in Tropical Precipitation Intensity in Observations and Climate Models. Climate Dynamics, https://doi.org/10.1007/s00382-024-07287-y.