“Hot, sticky, miserable weather” – you might think that description reflects a typical Maryland summer. But actually, those words were written 72 years ago, by glaciologist Carl Benson while working on the Greenland Ice Sheet.
At the time, Benson and his team of glaciologists had no idea why they were experiencing relatively warm weather on the ice sheet. Now, scientists have solved the decades-old mystery behind the unusual weather in July 1954. Their findings, published in the Journal of Glaciology, reveal how today’s technology can help scientists better understand Greenland’s past and monitor its future. The study was authored by Benson, who passed away on January 16, 2026 at the age of 98, as well as Earth System Science Interdisciplinary Center scientist Dorothy Hall and Rick Thoman and Matthew Sturm of the University of Alaska.
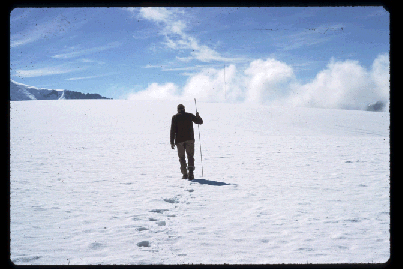
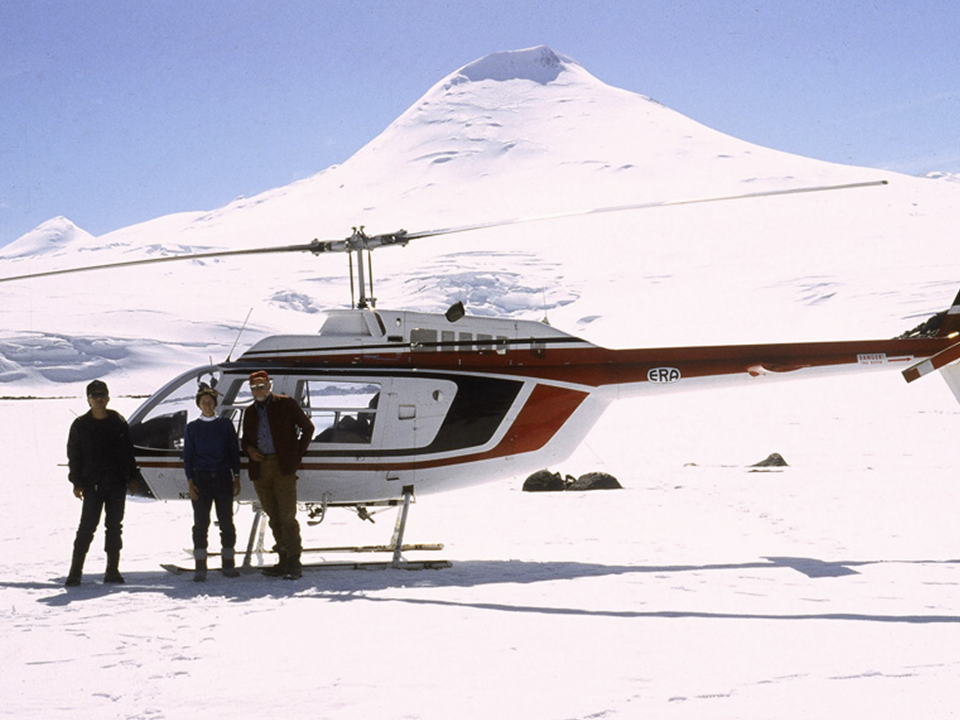
In July 1954, a research team working for the U.S. government ventured from Thule Airbase (now named Pituffik Space Base) in Northwest Greenland to study the structure, behavior and geologic history of the ice sheet. Over four years, the team, led by Benson, dug pits into the snow, collected samples, and carefully documented the physical properties of the ice sheet, work that would provide a fundamentally new understanding of ice sheets and glaciers.
On July 11, 1954, the weather turned, and it began to rain. Suddenly, the glacier’s surface temperature rose considerably – above freezing. This persisted for over 60 hours, melting the glacier’s surface into slush.
“Solid overcast, surface snow very wet, good for making snowballs,” wrote Benson in his July 12, 1954 field notes, “Hot, sticky, miserable weather.”
The slushy surface made traversing the glacier impossible, leaving the team stranded. But it also presented a rare scientific opportunity to trace surface water as it flowed through the snow and firn – dense, granular snow not yet compacted into ice– in a part of the ice sheet that rarely ever melts. They saw firsthand how meltwater trickles through channels to create ice lenses and layers upon refreezing.
The warm and wet weather persisted for three days. But even years afterwards, evidence of this melt event was visible in the stratigraphy of the glacier as refrozen slush layers and meltwater columns. The melt event had permanently changed the geological makeup of the glacier.
A year later, the team drilled an ice core – a cylindrical sample of ice – about 48 km away. The sample revealed that the 1954 melt was the heaviest in 68 years. They also learned that melt events were limited from 1886 to the 1920s, and then became much more frequent.
The researchers also discovered that evidence of the 1954 melt event appeared clearly on two walls of a three-meter snow pit but was absent on the other two, showing that meltwater had flowed through isolated channels rather than spreading evenly throughout the snowpack.
“Because surface melt on the Greenland Ice Sheet may often be channeled into ‘percolation columns,’ isolated ice cores may not capture historical melt events,” said Hall, “Ice cores, though extremely valuable, may greatly underestimate the extent of melt throughout a column of Greenland ice. Thus we cannot know for certain the extent of historical melt events even when ice cores are available.”
Satellite sensors are far more effective than ice cores when it comes to mapping the extent of melting across an ice sheet. While ice cores provide detailed, localized information about the intensity of past melt events, they are limited to specific drilling sites and require the time and effort of on-site scientists to extract and analyze. In contrast, satellite sensors can offer a broader, real-time view of the ice sheet, allowing scientists to monitor surface melt across vast areas with precision.
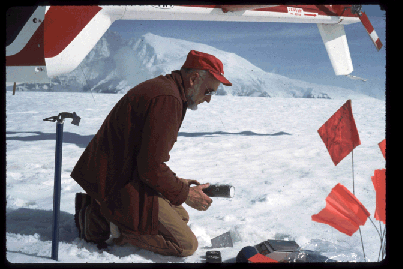
“At that time, there was no way to view the ice sheet from above, so their ability to understand and explain the perplexing melt event was limited,” said Hall, “We can use today’s technology to help explain some decades-old problems such as ‘why was there rain at such a high latitude on the Greenland Ice Sheet in July of 1954?’”
After seven decades, the cause of the warm, wet weather that puzzled Benson and the original field team can be explained: an atmospheric river. Atmospheric rivers are long, narrow bands of water vapor in the atmosphere. The size and strength of these “rivers in the sky” can vary, but the average atmospheric river carries enough water vapor to equal the flow of the Mississippi River, and strong atmospheric rivers can carry up to 15 times that amount. Atmospheric rivers were not identified until the early 1990s, but today are widely recognized as a key mechanism for transporting warm, moist air to Greenland.
The study also highlights how dramatically scientists’ ability to monitor Greenland has changed since Benson’s expeditions. During his fieldwork, Benson developed the glacier-facies concept, which divides the ice sheet into distinct ‘melt zones’ (facies) based on how much snow melts and refreezes at different elevations. Today, satellites allow scientists to map those facies across the entire ice sheet and watch the facies boundaries change over time.
As Earth’s climate warms, the boundaries between glacier facies are shifting uphill and farther inland. Areas that once remained frozen year-round are increasingly experiencing seasonal melting and refreezing. Tracking these shifting boundaries helps scientists measure whether the Greenland Ice Sheet is gaining or losing ice, providing critical insight into how climate change is reshaping the Arctic and contributing to global sea-level rise.
“Ice on Greenland would contribute approximately 7.4 m to sea level if it melted completely. Even partial melting contributes to shoreline changes in coastal areas throughout the world,” said Hall, “With satellite data, we can monitor changes in the boundaries of the facies which indicate the ice sheet’s response to changes in climate.”