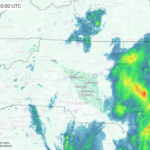
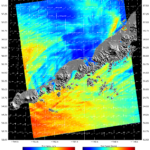
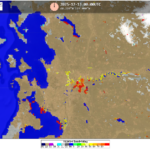
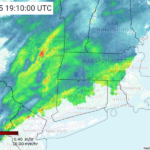
For the third week in a row, parts of Texas and the Deep South were once again the target for thunderstorms and torrential downpours. The National Weather Service (NWS) Weather Prediction Center (WPC) Extended Forecast Discussion highlighted the heavy rain risk on 02 May 2025: “By monday, the system will become stationary over the Plains, allowing moisture to continuously pool over the Plains, which will likely result in a multi-day heavy rainfall event across the Central and Southern Plains and into the lower Mississippi Valley Monday-Wednesday”. The Day 4 WPC Excessive Rainfall Outlook (ERO) issued at 0711 UTC 03 May 2025 already had a Moderate Risk of rainfall exceeding flash flooding guidance within 25 miles of a point for Tuesday morning through Wednesday mornings across portions of the lower Mississippi Valley.

Indeed by the 0000 UTC 06 May 2025 Surface Analysis on Monday evening, a stationary front sat across the Lone Star State, with an outflow boundary located across eastern Texas and a dry line located across western Texas, providing lift for convection to develop.

Later on 06 May 2025, the low pressure system over western Texas had crawled eastward, with an associated cold front cutting through central parts of the state, with areas to the east in the warm sector. The instability and resulting moisture from the Gulf allowed an intense line of storms to develop. GOES-East 1-minute Mesoscale Geocolor imagery overlaid with GLM Group Energy Density, distance-weighted GLM ‘group’ energy over 1-minute for the mesoscale, from ~2120 to ~2220 UTC 06 May 2025 provided a look at the electric storms stretching from eastern Texas to Louisiana.

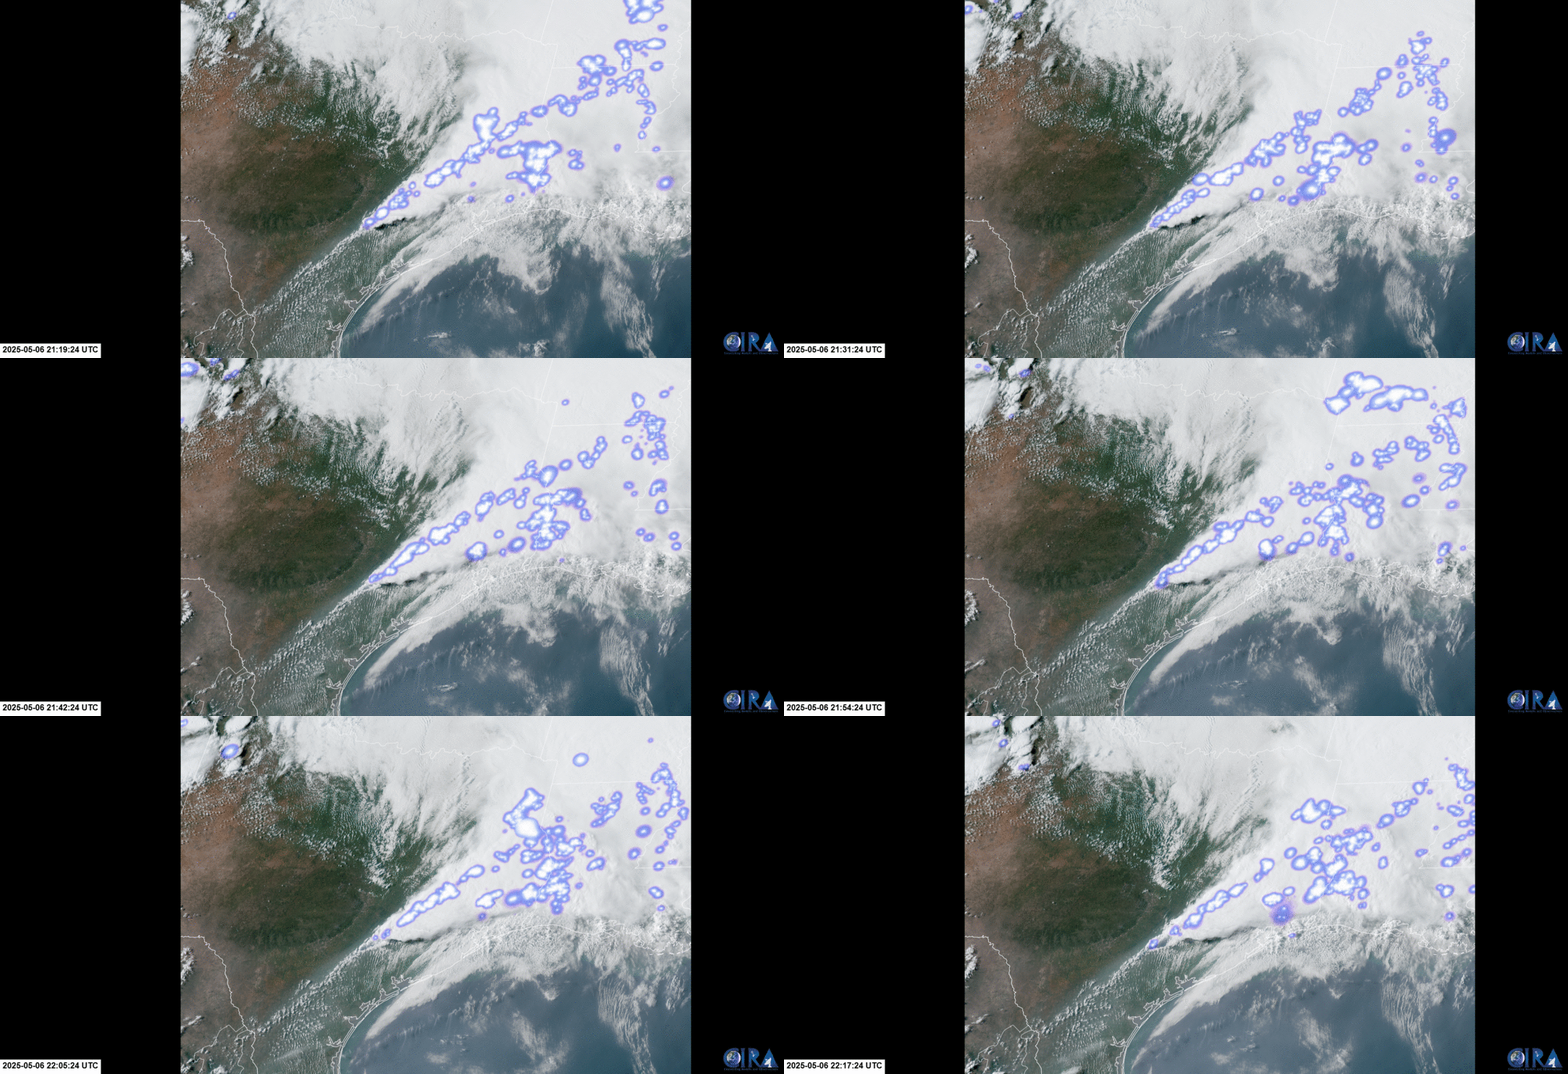
The storms resulted in many wind and hail reports, especially across Louisiana, and several Flash Flood Warnings were issued TX and LA, including over a dozen issued by the Shreveport, LA, office on 06 May 2025.

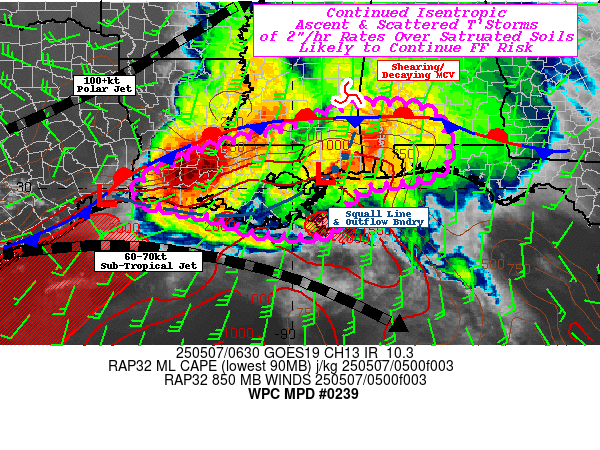
Heading into the overnight, NWS WPC issued a Mesoscale Precipitation Discussion (MPD) at ~0645 UTC 07 May 2025, highlighting the flash flooding risk across the Central Gulf Coast supported by a “deep moist profile support 2-2.25″ total PWats” (Precipitable Water values). The National Environmental Satellite, Data, and Information Service (NESDIS) Office of Satellite and Product Operations (OSPO) Advected Layered Precipitable Water (ALPW) imagery from 0500 UTC 07 May 2025 confirmed PWats >2″ in Southwest Louisiana, where the MPD went into effect.

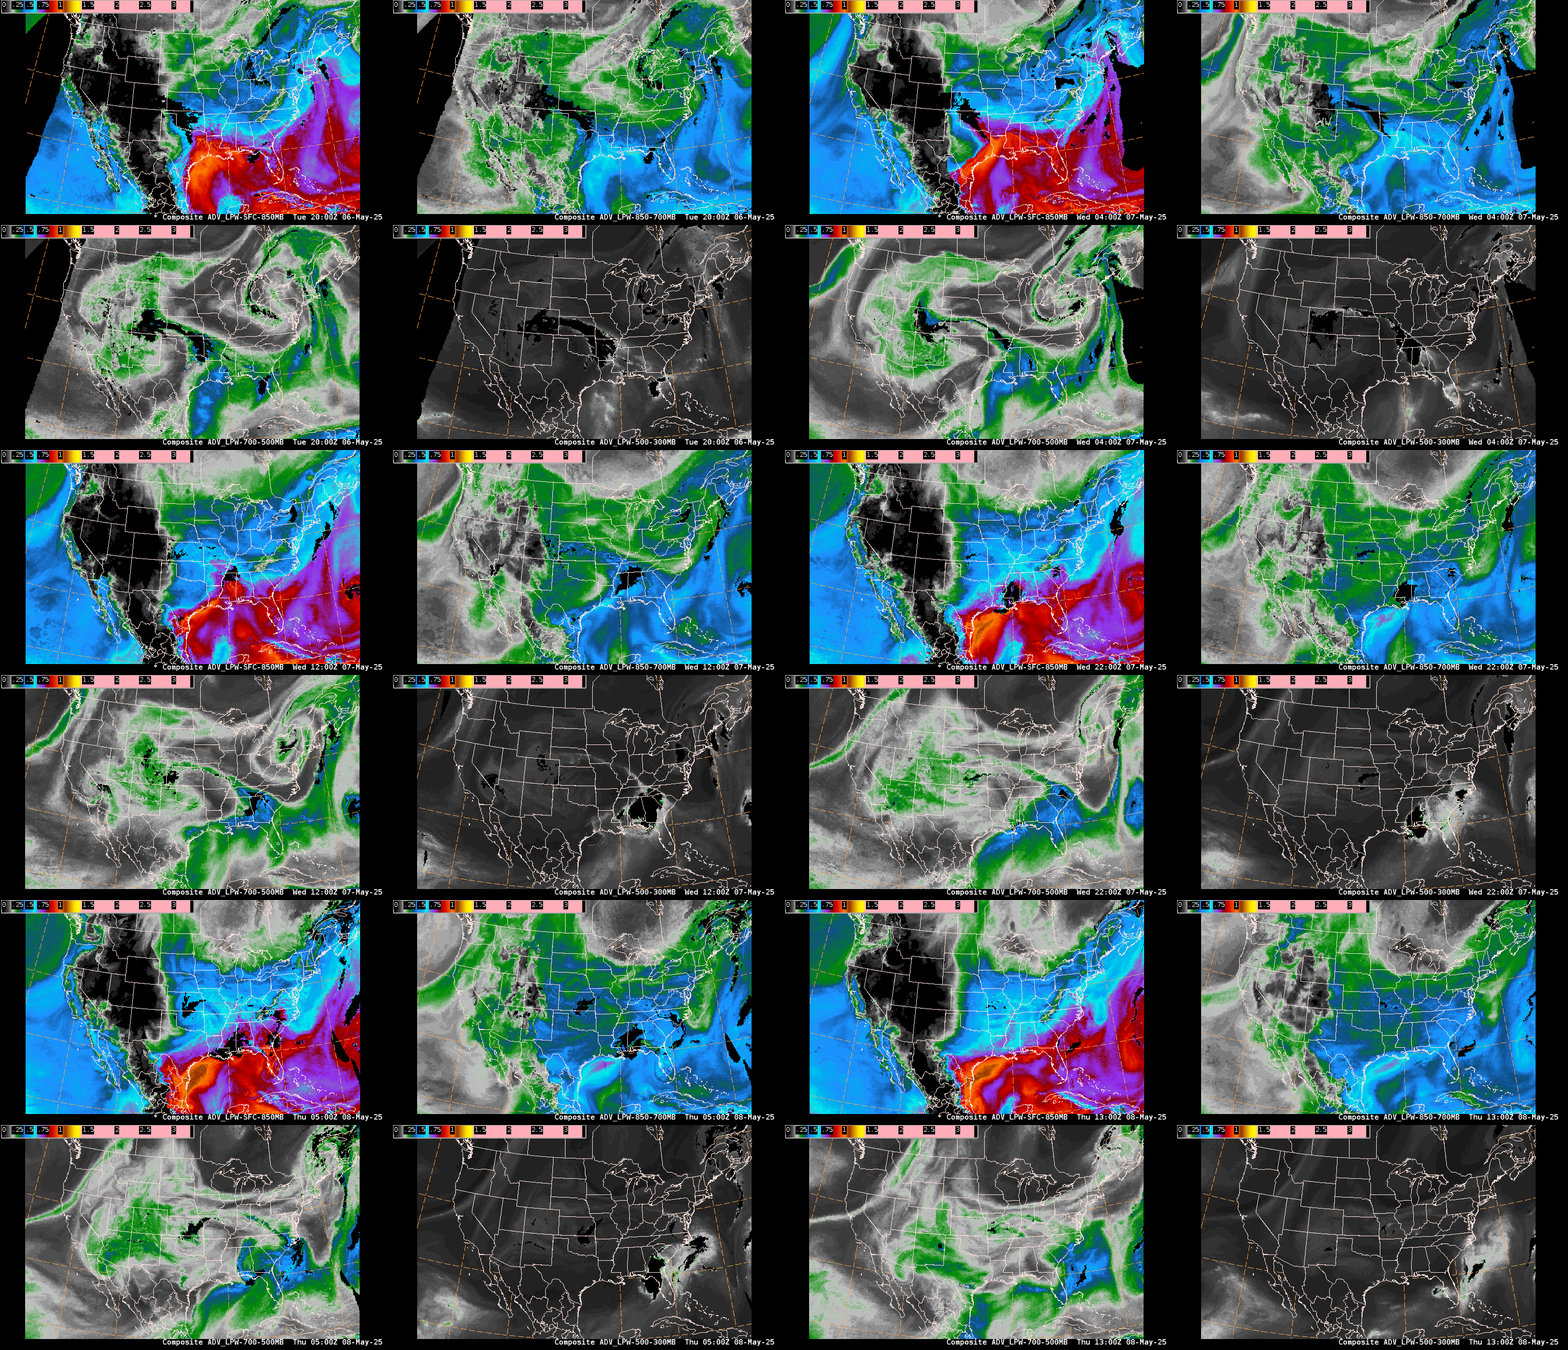
A look at a longer timeframe from 2000 UTC 06 May to 1300 UTC 08 May 2025 helped to identify the source of the low-level moisture plume from the Gulf, while moisture from the 700 to 500 hPa layer had a connection to the eastern Tropical Pacific.
At first, it appeared that the large complex of storms was beginning to fizzle in IR imagery early in the morning on 07 May 2025 (~0900 UTC 07 May 2025), but ample amounts of moisture along the Gulf Coast was still in place. Well enough, GOES-East Full Disk 10-minute Band 13 imagery by 1030 UTC showed the expansion of storms in TX into LA, allowing heavy rain to continue to fall into Thursday morning.
Figure 9: GOES-East Full Disk Clean-Infrared (IR) Longwave Window imagery valid ~1300 UTC 06 May to ~1300 UTC 07 May 2025. From CIRA Slider
GCOM-W/Advanced Microwave Scanning Radiometer 2 (AMSR2) 89 GHz RGB imagery was recently made available in AWIPS for forecasters to utilize at WPC. The RGB imagery at 1756 UTC 07 May 2025 had bright red values, signaling a high amount of ice concentration and deep convection, across southeastern Louisiana, while lighter aqua colors off the Texas Gulf Coast signaled trailing showers and warm, lower-level clouds. The NWS Total Operational Weather Readiness – Satellites (TOWR-S) Polar Planner Tool allows forecasters to track when the next polar-orbiting satellite may pass a location of interest and provide key data.

This week, the wet weather will be targeting areas further east, bringing beneficial rains to states like Florida. However, repeated rounds of heavy rain could result in Flash Flooding, where a Moderate Risk ERO is in effect today across the South Florida metro areas.


