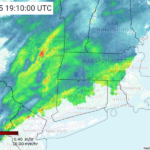
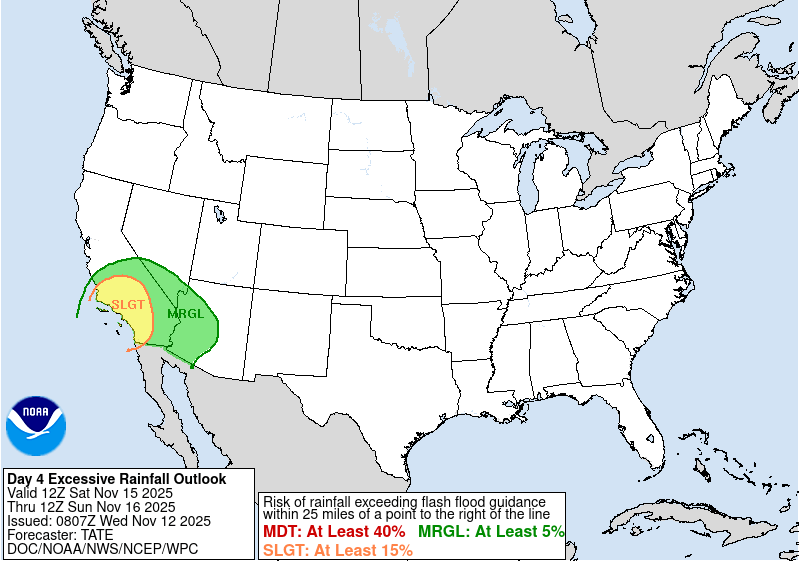
One of the first atmospheric rivers (ARs) of the season delivered an early-season soaking to southern parts of the Golden State. The NWS Weather Prediction Center (WPC) highlighted the threat for flash flooding several days in advance, with the Day 4 Excessive Rainfall Outlook (ERO) signaling a Slight Risk ERO for the 24-hour period ending at 1200 UTC 16 November 2025. By Day 2, a Moderate Risk ERO, defined as at least a 40% risk of rainfall exceeding flash flood guidance within 25 miles of a point, was issued for much of the Los Angeles (LA) metro area.

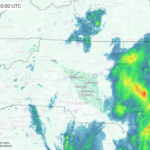
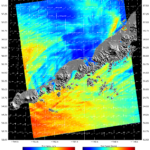
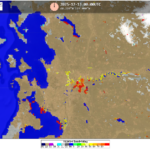
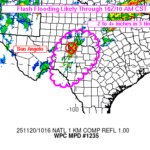
Flood watches were issued by Weather Forecast Offices (WFOs) like NWS Los Angeles/Oxnard on Thursday evening, 13 November 2025, for late Friday night through Saturday evening due to “Flooding caused by excessive rainfall”. In the early morning hours of Saturday morning, WPC issued a Mesoscale Precipitation Discussion (MPD): “Heavy rainfall will become more likely – especially beginning around the 14Z/6a Pacific timeframe…Flash flood potential will increase – especially across burn scars”. WPC MPDs highlight the threat for flash flooding over the next six hours, but can go out to 12 hours for ARs that impact the West Coast. Burn scars, which are extremely susceptible to debris flow and flash flooding due to hydrophobic soils, are frequently found across the West. The Canyon Fire Burn Scar was one of many that was featured in this MPD region, with high delta Normalized Burn Ratio (dNBR) values signaling vegetation that’s severely damaged. The Cooperative Institute for Meteorological Satellite Studies (CIMSS) produces experimental Burned area Rapid Interim Severity RisK (BRISK) maps from GOES, JPSS, Landsat, and Sentinel-2 satellite composites, for the time period after fires reach 5,000 acres until USGS and U.S. Forest Service team members can conduct field investigations.


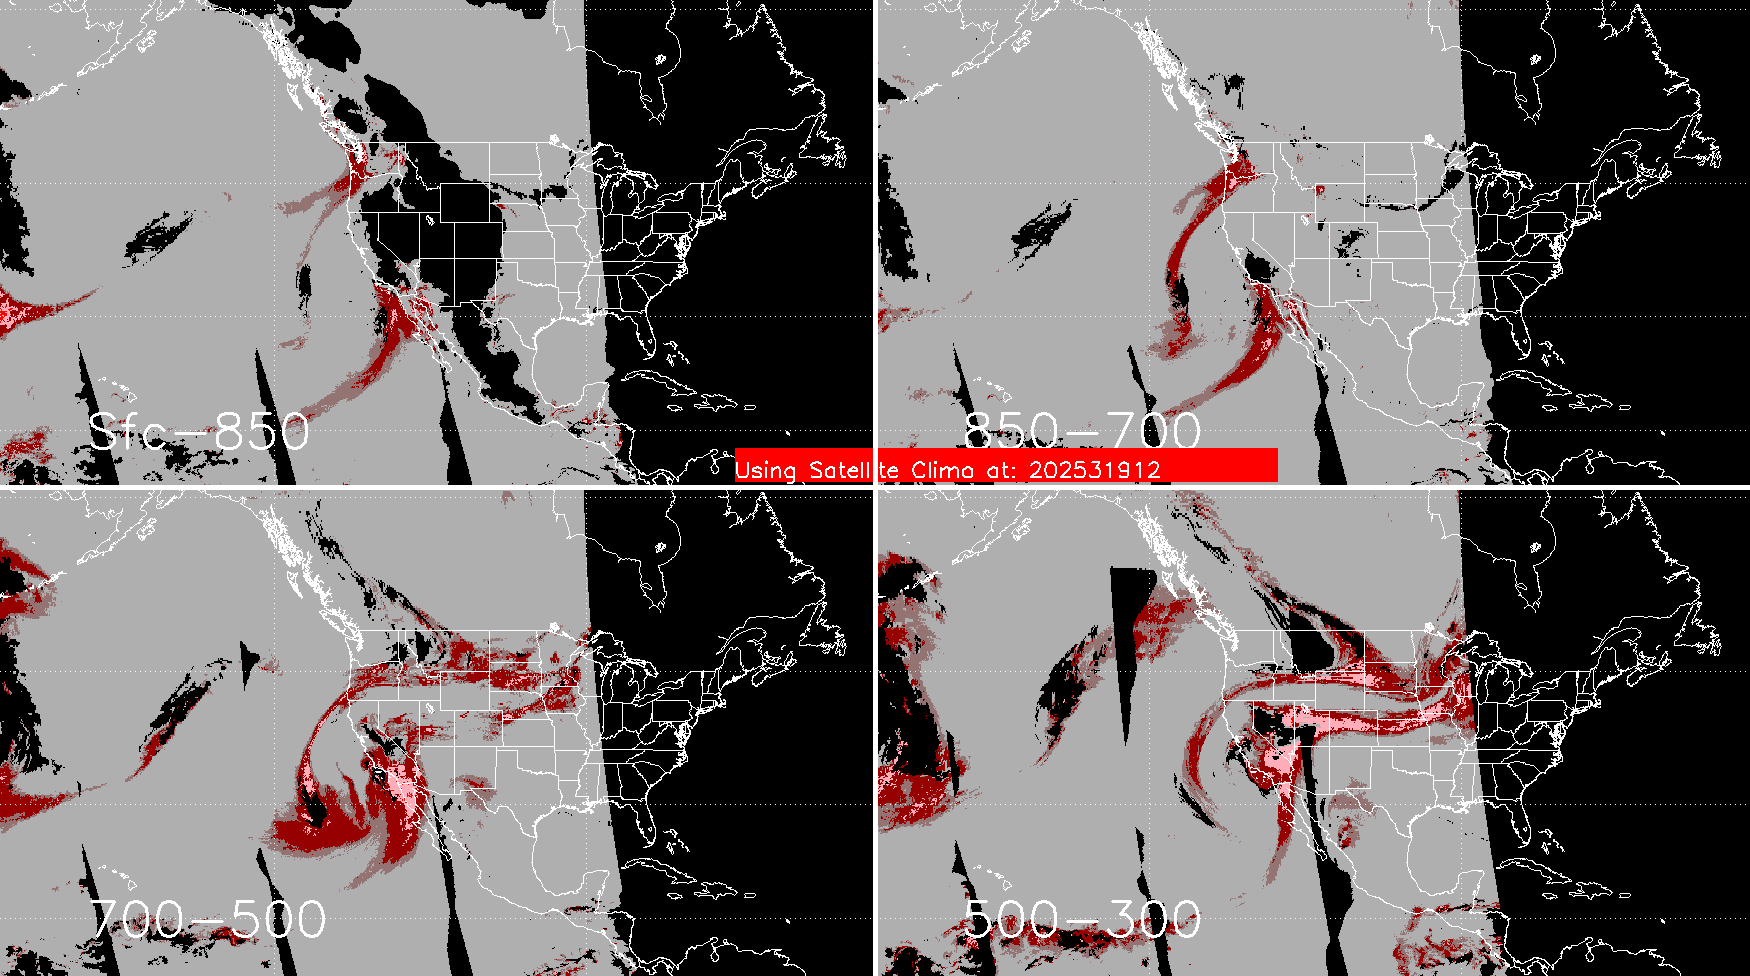
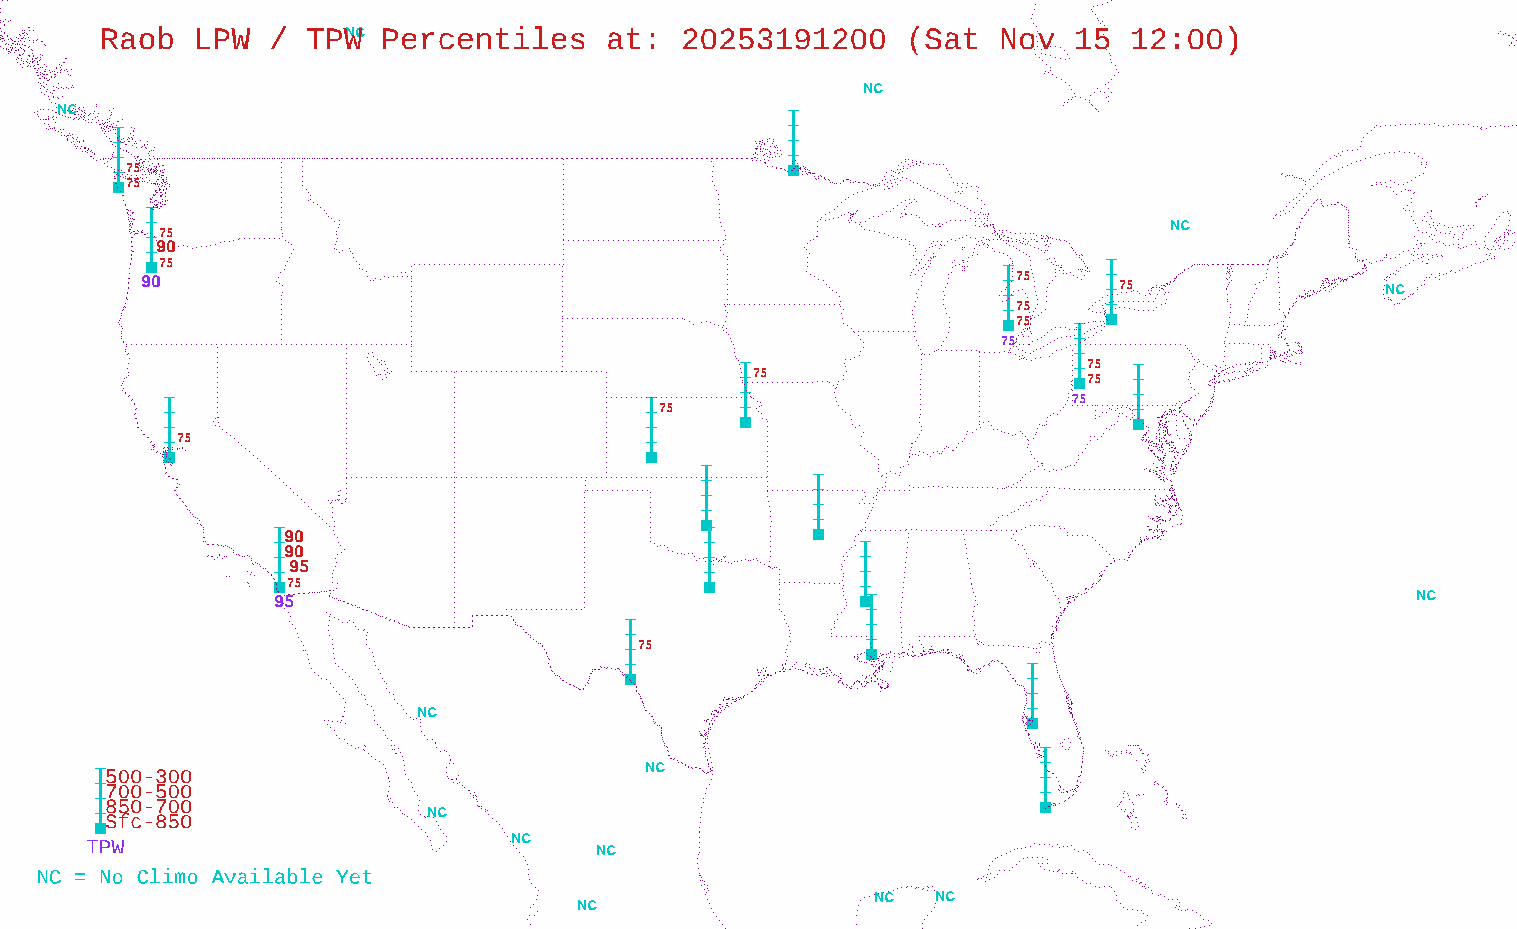
The Cooperative Institute for Research in the Atmosphere (CIRA) Advected Layered Precipitable Water (ALPW) Percentile product at 1200 UTC 15 November 2025 showed ALPW ranking above the 90th percentile in the lower-layers along the immediate Southern CA Coast, and even higher values above the 95th percentile at the mid-to-upper levels, with a connection to the tropical East Pacific. RAOB percentiles confirmed satellite observations, with San Diego’s Total Precipitable Water (TPW) above the 95th percentile. RAOB percentiles are based on averages, with a site having at least 30 years of record.

GOES-West tracked the spinning area of low pressure and the associated AR as it meandered off the Southern CA Coast before pushing inland. The GLM Flash Extent Density (FED) observed ample lightning with storms across inland, arid areas of Southern California during the afternoon and evening, as well as a few thunderstorms across LA as the low pressure pushed ashore.
Figure 7: GOES-West Full Disk Mid-Level WV Band 9 imagery from ~1200 UTC 15 November to ~1200 UTC 16 November 2025. Credit: NESDIS/STAR
Figure 8: GOES-West CONUS Geocolor imagery, overlaid with GLM FED output from ~1200 UTC 15 November to ~1200 UTC 16 November 2025. Credit: NESDIS/STAR
Over the past week, much of the LA metro has seen 3-5″ of rain, with much heavier amounts up to and exceeding 10″ in Santa Barbara County. These rainfall amounts over the past 7 days equate to at least 600 percent of normal across most of Southern California. More rainfall is expected throughout the work week before a drier pattern returns later this weekend.


