Finlon Receives NASA Field Campaign Support Award
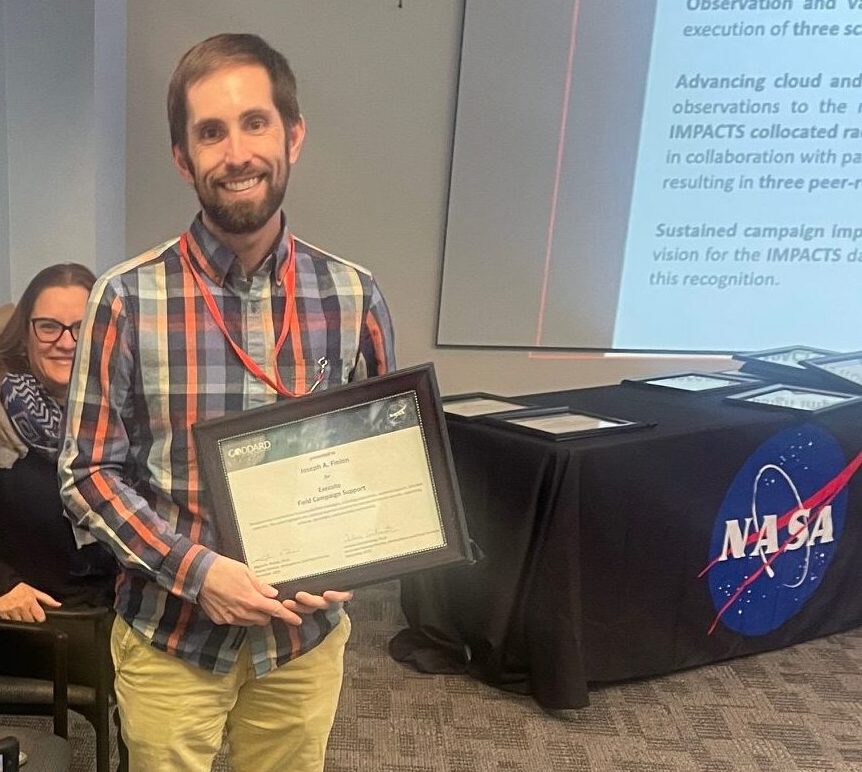
ESSIC Visiting Assistant Research Scientist Joseph Finlon is the newest recipient of the Field Campaign Support Award, one of the 2026 NASA Goddard Space Flight

ESSIC Visiting Assistant Research Scientist Joseph Finlon is the newest recipient of the Field Campaign Support Award, one of the 2026 NASA Goddard Space Flight

Daniel Cziczo, Daniel Cziczo, Professor & Department Head of Earth, Atmospheric and Planetary Sciences at Purdue Marty Ralph, Director, Center for Western Weather and Water

Many ESSIC scientists attended and presented at this year’s American Meteorological Society Annual Meeting, which took place from 25 to 29 January 2026 in Houston,

Lars Peter Riishojgaard gives the Introduction to the Climate Resilience Network. Photo by Cazzy Medley. On January 20-21, University of Maryland’s Earth System Science Interdisciplinary

ESSIC scientist Justin Pflug recently participated in the AskScience “Ask Me Anything” series, a Reddit project hosted by University of Maryland’s College of Computer, Mathematical,

American Geophysical Union (AGU) held its annual meeting in New Orleans, Louisiana over 15-19 December 2025. AGU is the largest gathering of Earth and space

Last week, the Earth System Science Interdisciplinary Center held their annual Collaborative Partner Reception and Awards Ceremony. During the event, ESSIC Director Lars Peter Riishojgaard

Wildfires are a growing threat to the global population. As temperatures rise, rainfall patterns shift, and the landscape is modified, fires are becoming more difficult
ESSIC is once again hosting its annual Collaborative Partner Reception and Awards Ceremony on December 11, 2025 at 11:30 AM. This is your opportunity to

As the climate warms, wildfires are becoming more severe and unpredictable. Shifts in wind, weather, and fuel conditions can cause fires to change direction or