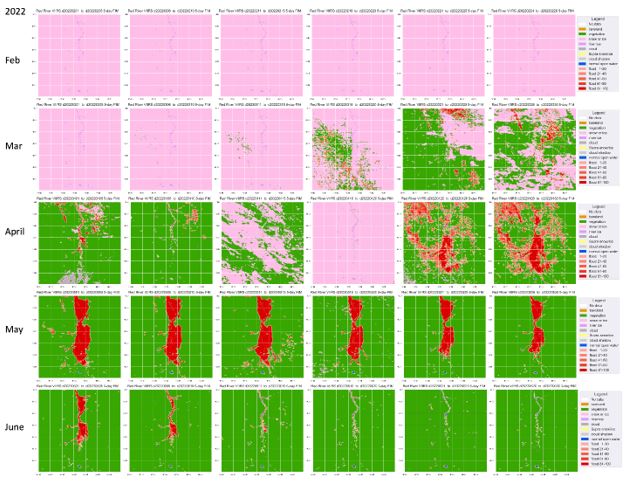
Quingyuan Zhang on the VIIRS Flood Inundation Maps for the 2022 Red River Flood
ESSIC/CISESS Scientist Qingyuan Zhang has collaborated with NOAA’s Sean Helfrich (STAR/SMCD) to explore and document the Red River flood in 2022.
")
ESSIC/CISESS Scientist Qingyuan Zhang has collaborated with NOAA’s Sean Helfrich (STAR/SMCD) to explore and document the Red River flood in 2022.
ESSIC/CISESS scientist Daile Zhang was invited to serve on the Board of Directors and Executive Committee of the African Centres for Lightning and Electromagnetics Network (ACLENet).
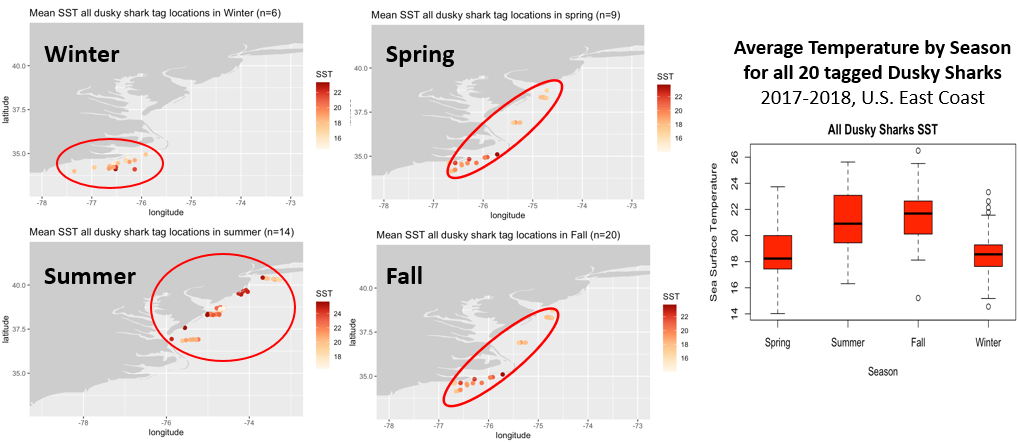
Ron Vogel, ESSIC/CISESS Senior Faculty Specialist, and Melanie Abecassis, ESSIC/CISESS Assistant Research Scientist, designed and taught a specially tailored NOAA CoastWatch satellite training class for the fisheries research community. The fishery researchers use tagged fish to understand population dynamics and ecosystem change; however, use of satellite data in this research is still somewhat limited. In order to fill this gap, the class featured satellite parameters that are underutilized in this research but have been identified by the fisheries community as an area for research growth, such as satellite-derived seascapes, geostrophic currents, sea surface height anomaly and salinity.
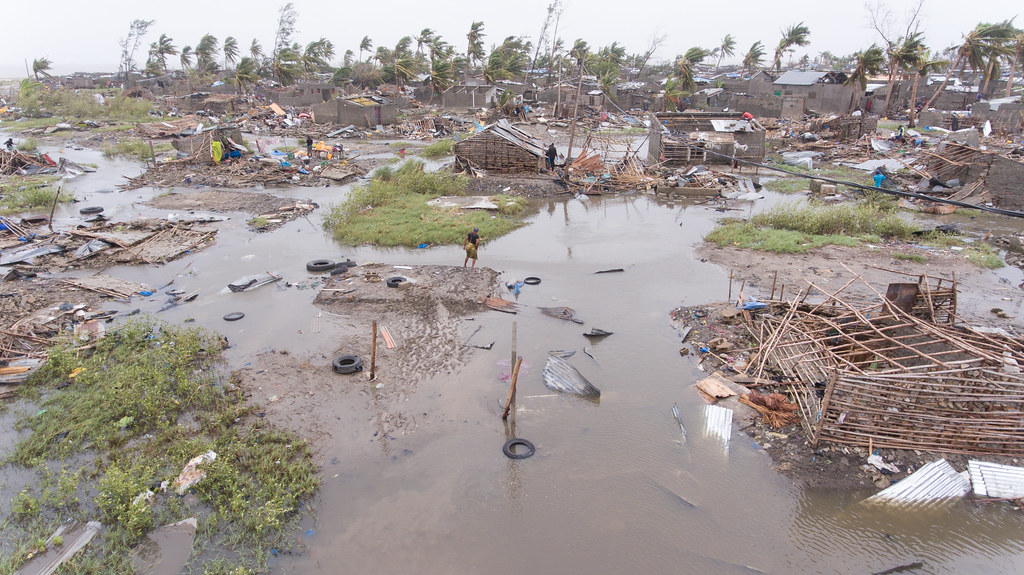
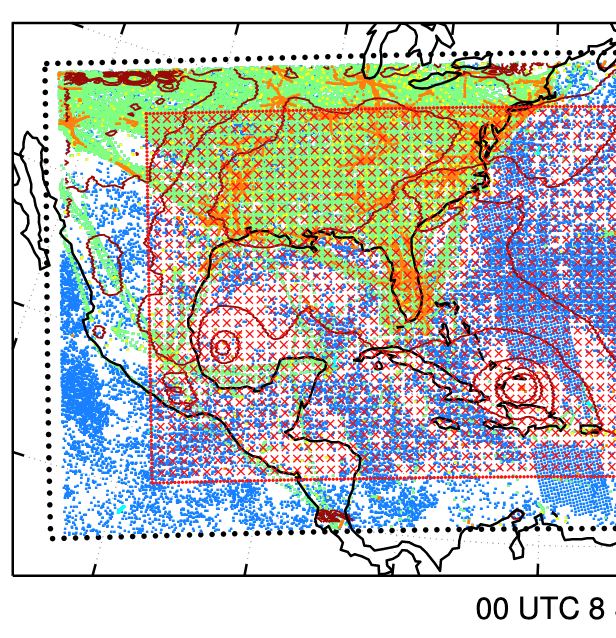
ESSIC/CISESS scientists Robert Adler, Guojun Gu, and Huan Wu have a new article in Journal of Flood Risk Management that examines results from the UMD/ESSIC Global Flood Monitoring System (GFMS) and various remote-sensing-based flood products in the context of the major 2019 flood in Mozambique.
ESSIC Task Sponsor and former UMD Professor Dr. George Huffman is the newest recipient of the 2022 William Nordberg Memorial Award for Earth Science.
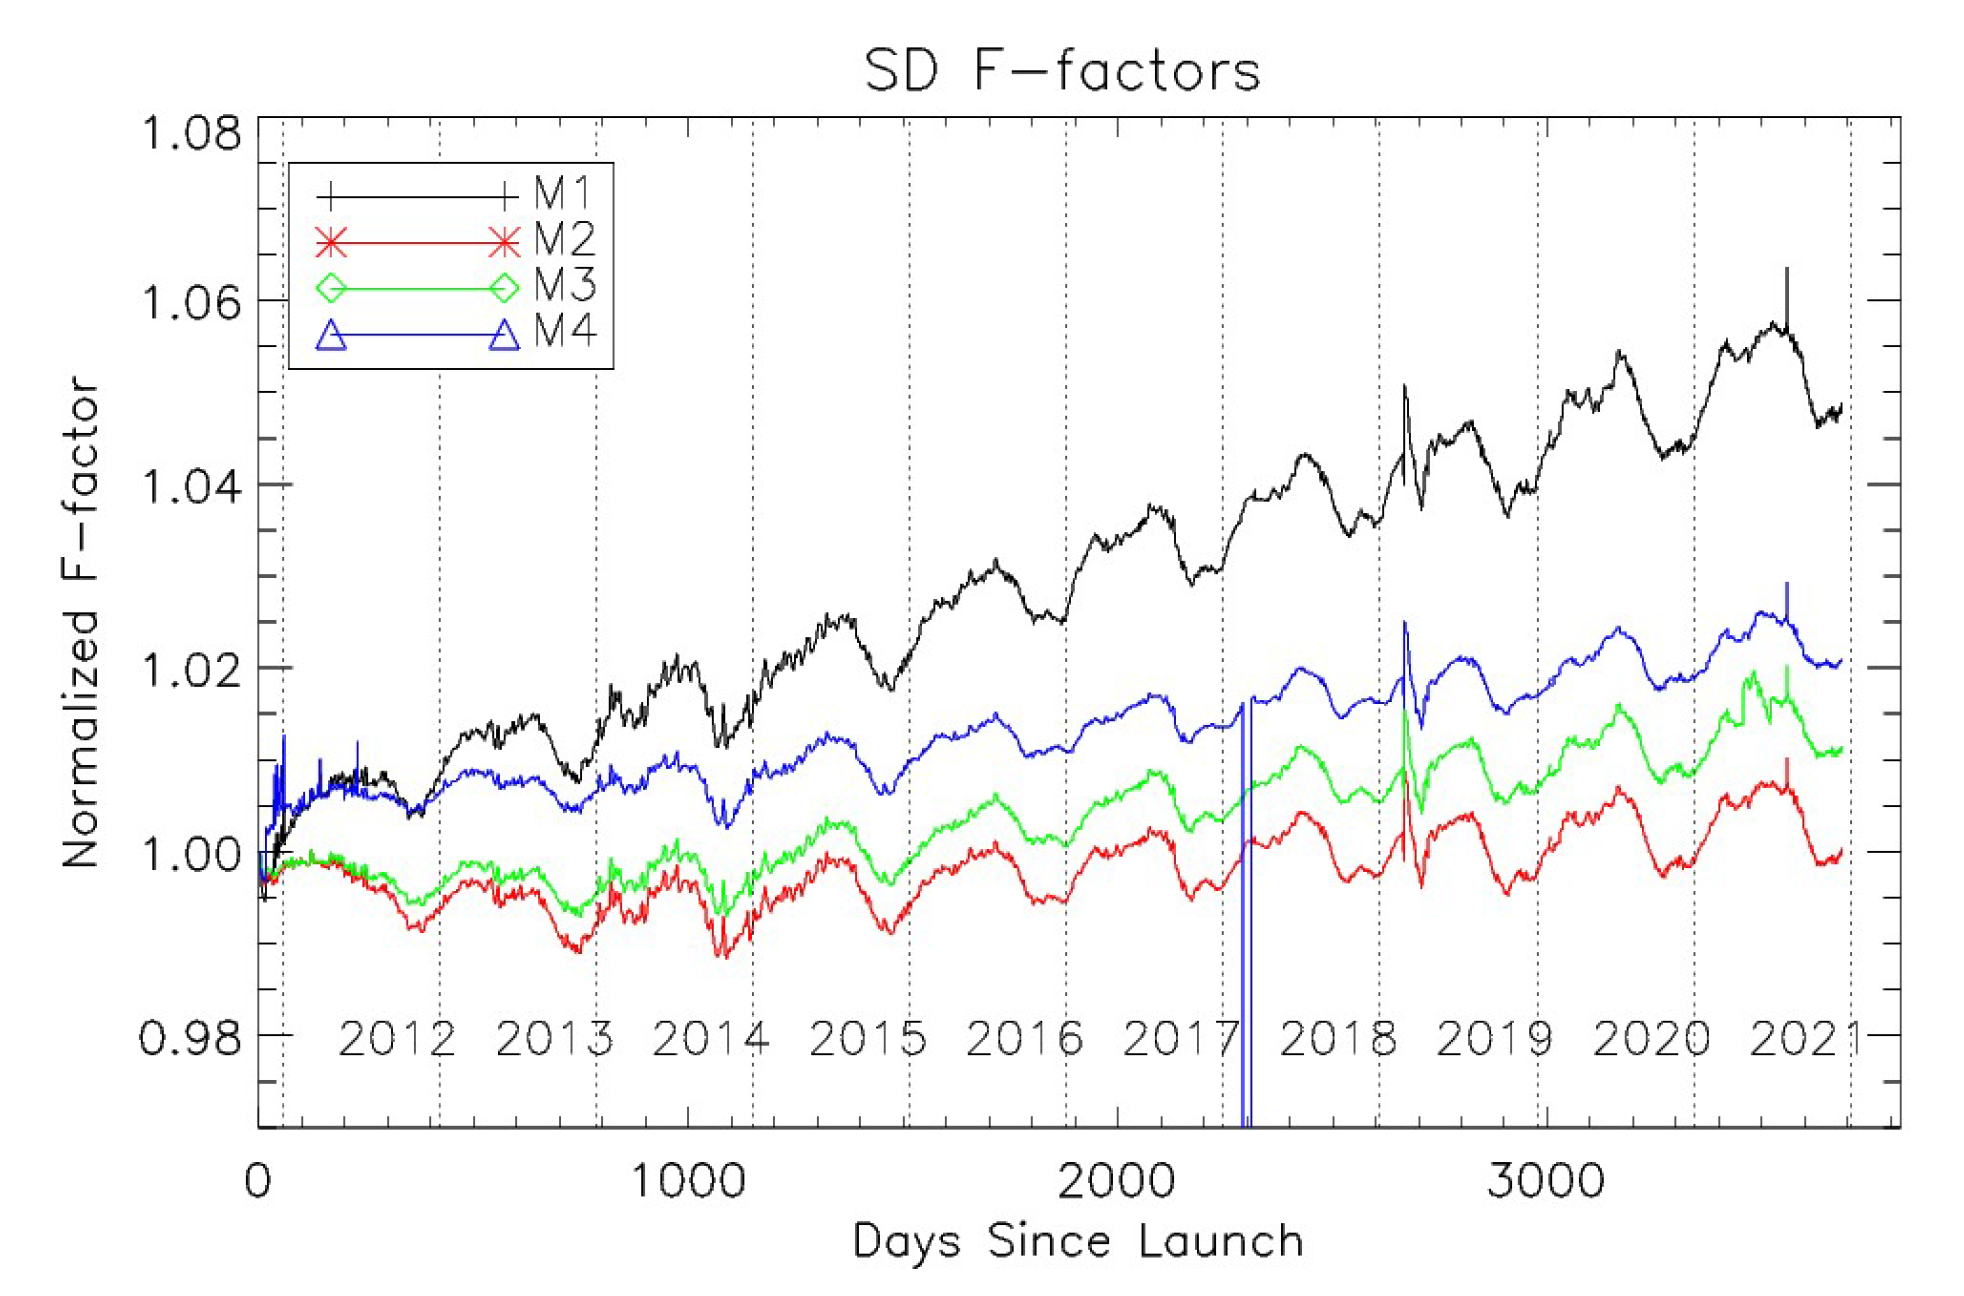
ESSIC/CISESS Scientists Xi Shao and Wenhui Wang co-published an article in Remote Sensing on July 13, 2022 that describes more than a decade of research on S-NPP VIIRS reflective solar bands (RSBs).
ESSIC/CISESS Scientist and University of Maryland Professor, Dr. Jonathan Poterjoy, has a new article published in the June issue of the Monthly Weather Review on some of the specialized data assimilation he has been working on with AOML and EMC.
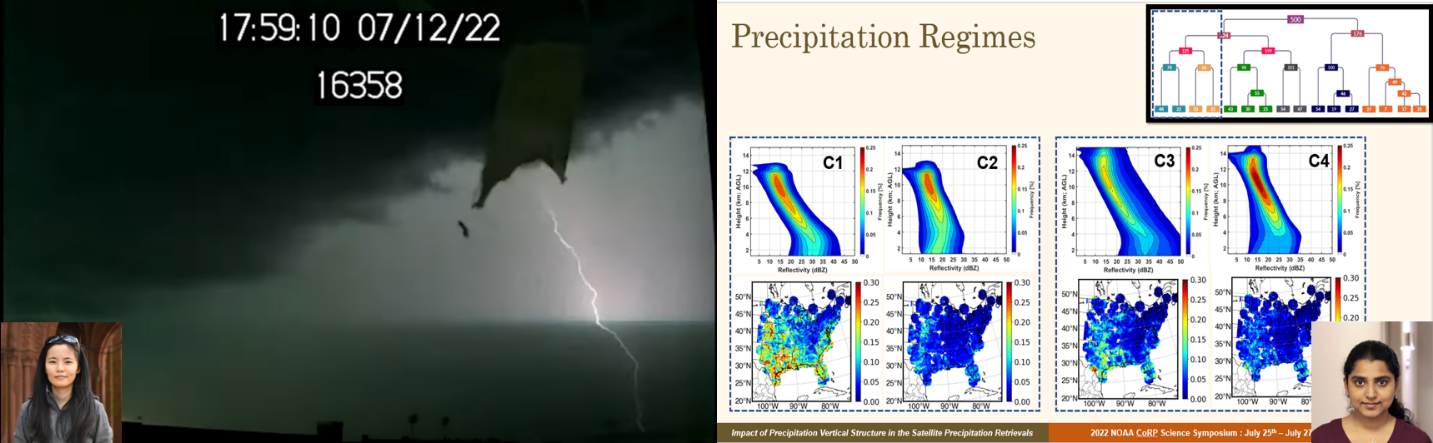
CISESS sponsored two early career scientists, Drs. Malar Arulraj and Daile Zhang, to attend the 2022 Cooperative Research Program (CoRP) Science Symposium, which was held in person on July 25th to 27th at the Cooperative Institute for Research in the Atmosphere (CIRA) of Colorado State University located in Fort Collins, CO.
ESSIC Assistant Research Scientist Julie Nicely was recently awarded the 2022 Robert H. Goddard (RHG) Award for Science. The award is named in honor of Robert Hutchings Goddard, pioneer in the field of rocketry.

ESSIC Postdoctoral Associate Jing Wei has been appointed as a new topical Editor (Atmosphere) for the journal Earth System Science Data (ESSD) of the European Geophysical Union.