Welcome to the Spring 2025 ESSIC Seminar Series!
Welcome to the Spring 2024 semester! We are pleased to announce the return of ESSIC’s Seminar Series. We have a wonderful lineup of senior and junior scientists who are prepared to deliver some compelling presentations about their work and research both in-person and remotely.
Some of our speaker highlights include Dalia Kirschbaum, Director of the Earth Science Division of NASA Goddard Space Flight Center; Neil M. Donahue, Director of Carnegie Mellon’s Steinbrenner Institute as well as professor and AGU Fellow; Claudia Tebaldi, scientist at Pacific Northwest National Laboratory’s Joint Global Change Research Institute and AGU Fellow; Ines Azevedo, associate professor at Stanford; Tracey Holloway, professor at UW–Madison and member of National Academy of Medicine; and Juan Lora, assistant professor at Yale.
Please click “Read more” for our full lineup and to add these events to your calendar now!


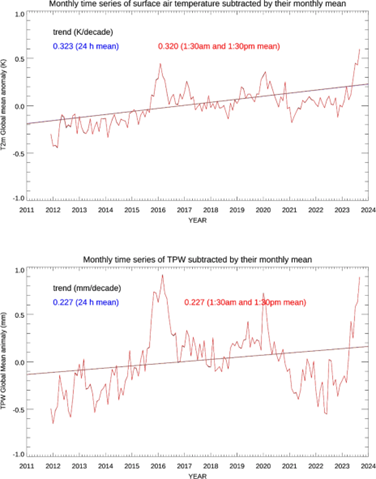
![Figure 3. Monthly TPW anomaly time series shown in red for ERA5 and blue for MiRS SNPP, 2012-2021. The straight lines are the linear regression fits. [a] is for global, [b] for Tropics, and [c] for mid-latitude regions, respectively.](https://essic.umd.edu/wp-content/uploads/2024/11/grassotti-zhou.png)

