
CISESS Goes to Augmented World Expo
Figure 1. Damian Figueroa, Guangyang Fang, and Samuel Wiggins (From left to right) at the AWE USA Conference in Long Beach, CA. by Guangyang Fang
")
Figure 1. Damian Figueroa, Guangyang Fang, and Samuel Wiggins (From left to right) at the AWE USA Conference in Long Beach, CA. by Guangyang Fang
The U.S. offshore wind energy industry is a growing endeavor. As such, stakeholders in this industry need information about winds from the ocean surface up
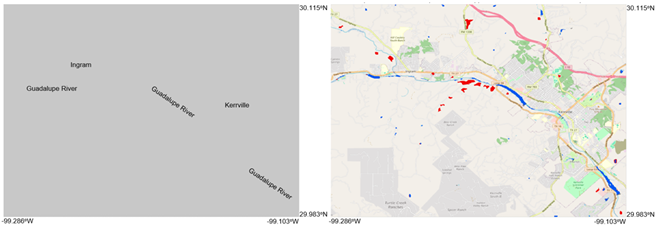
The July 2025 flood event in Texas Hill Country, fueled by remnants of Tropical Storm Barry, resulted in, to date, 135 fatalities, including 28 children
Congratulations to Justin Pflug, a recipient of a 2025 NASA Agency Honor Award. Pflugreceived an Early Career Achievement award, a prestigious honor that recognizes “unusual
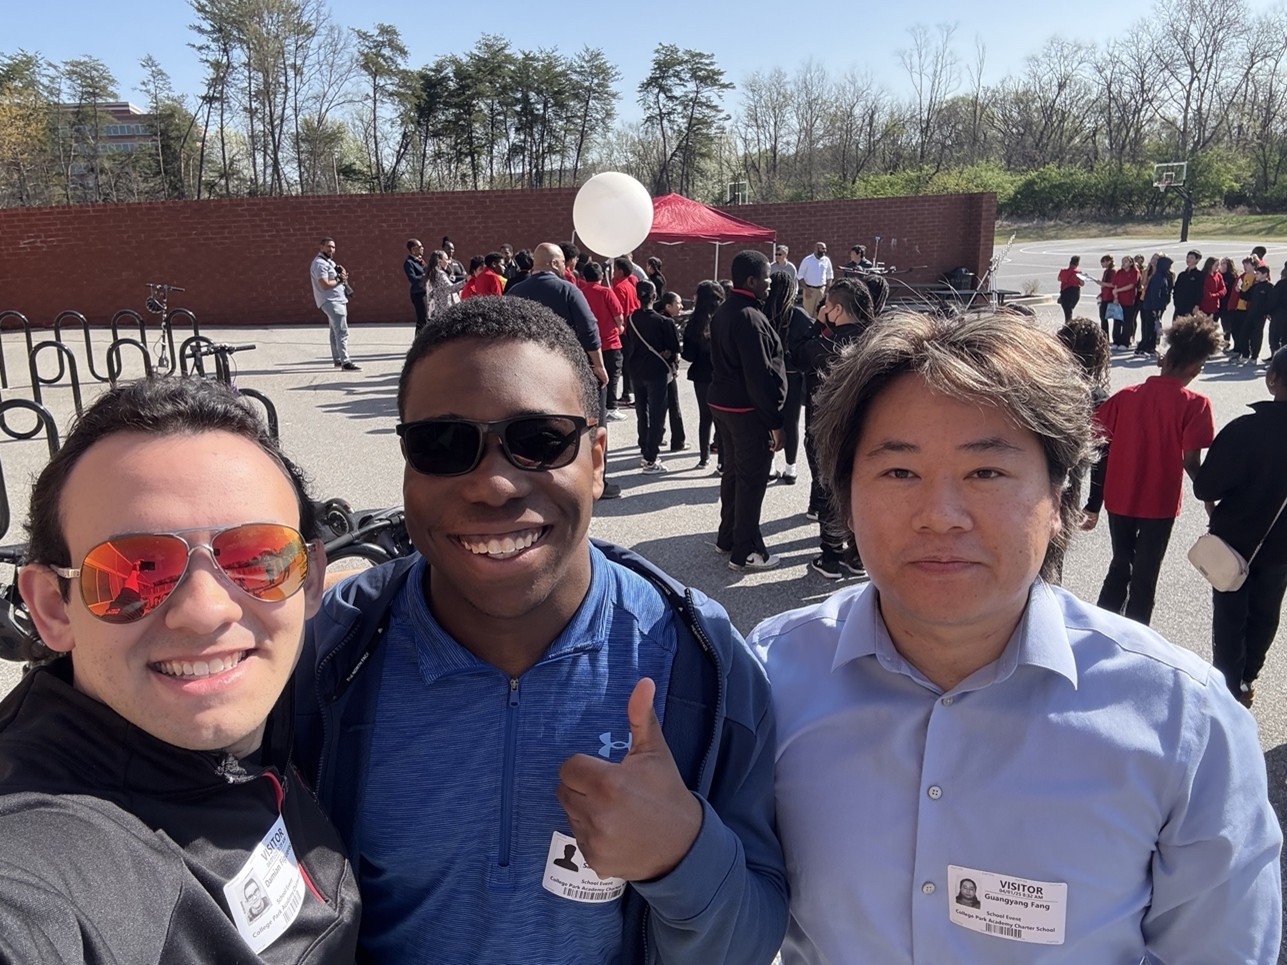
Figure 1. CISESS Interns Damian Figueroa and Samuel Wiggins, along with Dr. Guangyang Fang (from left to right) at the NWS Weather Day held at
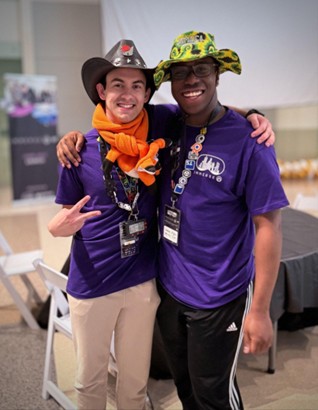
by Guangyang Fang In early April, CISESS students Damian Figueroa and Samuel Wiggins traveled to Atlanta, Georgia, to participate in ImmerseGT—an XR hackathon hosted by

On March 27, the University of Maryland celebrated the achievements of over 250 faculty scholars and researchers at the 2025 Maryland Research Excellence Celebration. The

Figure. CISESS students Damian Figueroa (left) and Samuel Wiggins (right) at the MIT Reality Hack. On 23 January 2025, CISESS students Damian Figueroa and Samuel
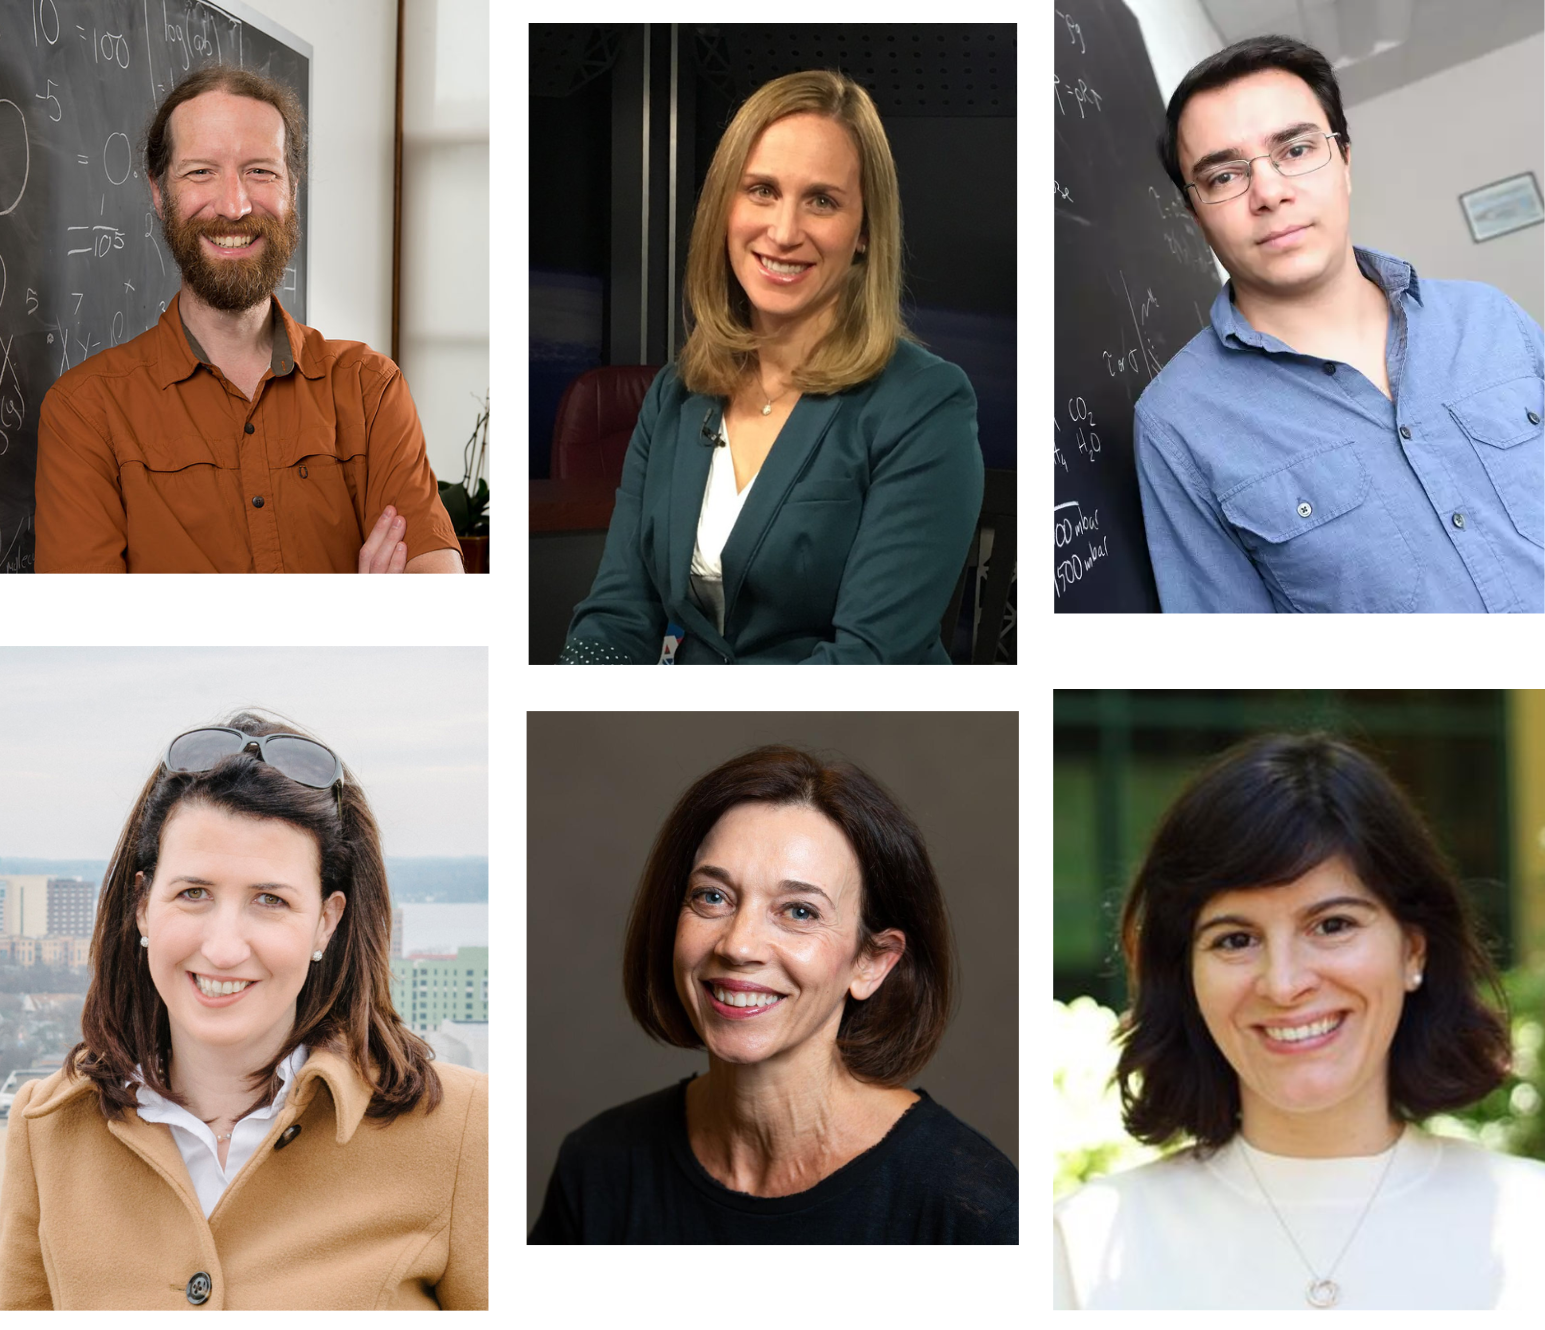
Welcome to the Spring 2024 semester! We are pleased to announce the return of ESSIC’s Seminar Series. We have a wonderful lineup of senior and junior scientists who are prepared to deliver some compelling presentations about their work and research both in-person and remotely.
Some of our speaker highlights include Dalia Kirschbaum, Director of the Earth Science Division of NASA Goddard Space Flight Center; Neil M. Donahue, Director of Carnegie Mellon’s Steinbrenner Institute as well as professor and AGU Fellow; Claudia Tebaldi, scientist at Pacific Northwest National Laboratory’s Joint Global Change Research Institute and AGU Fellow; Ines Azevedo, associate professor at Stanford; Tracey Holloway, professor at UW–Madison and member of National Academy of Medicine; and Juan Lora, assistant professor at Yale.
Please click “Read more” for our full lineup and to add these events to your calendar now!

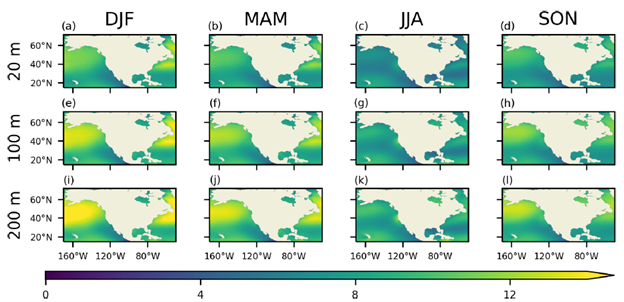
Figure. Regionally observed upper-2000-m change from 1958 through 2024 relative to a 1981–2010 baseline using Institute of Atmospheric Physics/Chinese Academy of Sciences data. Of the