Every gardener knows that the moisture of their soil is key to a rich harvest. But for Earth system scientists, soil moisture can be even more valuable: the key to research on climate variability and change, flood watch and precipitation observations, drought monitoring and wildfire predictions.
Scientists use soil moisture data to enhance research and improve the precision of weather and water forecasts. They depend on the Soil Moisture Operational Product System (SMOPS), developed by the National Environmental Satellite, Data, and Information Service (NESDIS) of the National Oceanic and Atmospheric Administration (NOAA), a system that integrates soil moisture data from multiple satellites to create a comprehensive global soil moisture map. However, while SMOPS is an invaluable tool, there has been a pressing need for a long-term SMOPS product to advance long-term climate studies and extended data assimilation operations.
As described in a recent study published in the Bulletin of the American Meteorological Society (BAMS), Earth System Science Interdisciplinary Center (ESSIC) scientist Jifu Yin has led a project to reprocess SMOPS with all available satellite soil moisture observations to generate a climate data record, deemed SMOPScdr. SMOPScdr records all available individual microwave satellite soil moisture observations over two decades, and offers improved accuracy, expanded spatial coverage, and an extended observation period from 2002 to the present. SMOPScdr incorporates advancements of using machine learning approaches, satellite radiance calibration, intersatellite bias correction, and observation-driven quality control.
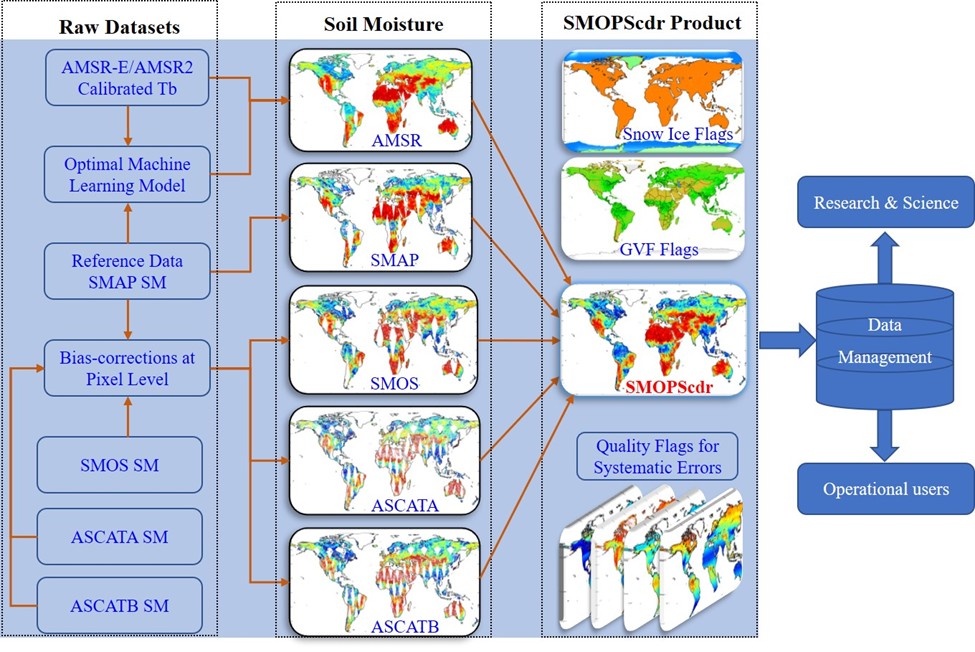
The strategy for developing the SMOPScdr product. SMOPScdr is a climatological soil moisture product from 2002 onward developed by integrating six satellites through enhanced algorithms and data reprocessing, which can find applications in a wide range of scientific and operational applications.
“SMOPS delivers updates within just a few hours, while SMOPScdr provides a consistent long-term record. By combining the strengths of both, SMOPS can help improve weather forecasts, water management, drought monitoring and wildfire predictions,” said Yin.
As an example of application, Yin and his team applied SMOPScdr data retroactively to Hurricane Harvey, the category 4 hurricane that hit Texas in 2017 and caused catastrophic flooding. SMOPScdr captured the anomalies in the flood development caused by the storm, showing areas with excess soil moisture. The data effectively highlights the flooded areas of the August 26, 2017 landfall and illustrates how the flooding progressed over the following days.
SMOPScdr can also be used to monitor agricultural drought. The team also tested the SMOPScdr system against the U.S. Drought Monitor (USDM) to monitor drought conditions across the continental United States from 2003 to 2022. Overall, SMOPScdr was found to be very accurate, especially for severe droughts like those in 2003, 2011-12, 2018, and 2021-22.
“Our SMOPS climate data record provides more available observations, which ensures the farmers obtain more useful information to monitor drought conditions and the stakeholders have better capabilities to track hurricanes,” says Yin, “Besides that, the wider coverage across space and time makes SMOPScdr valuable for many uses, such as studying climate patterns, tracking floods and rainfall, assessing landslide risks and predicting wildfires.”
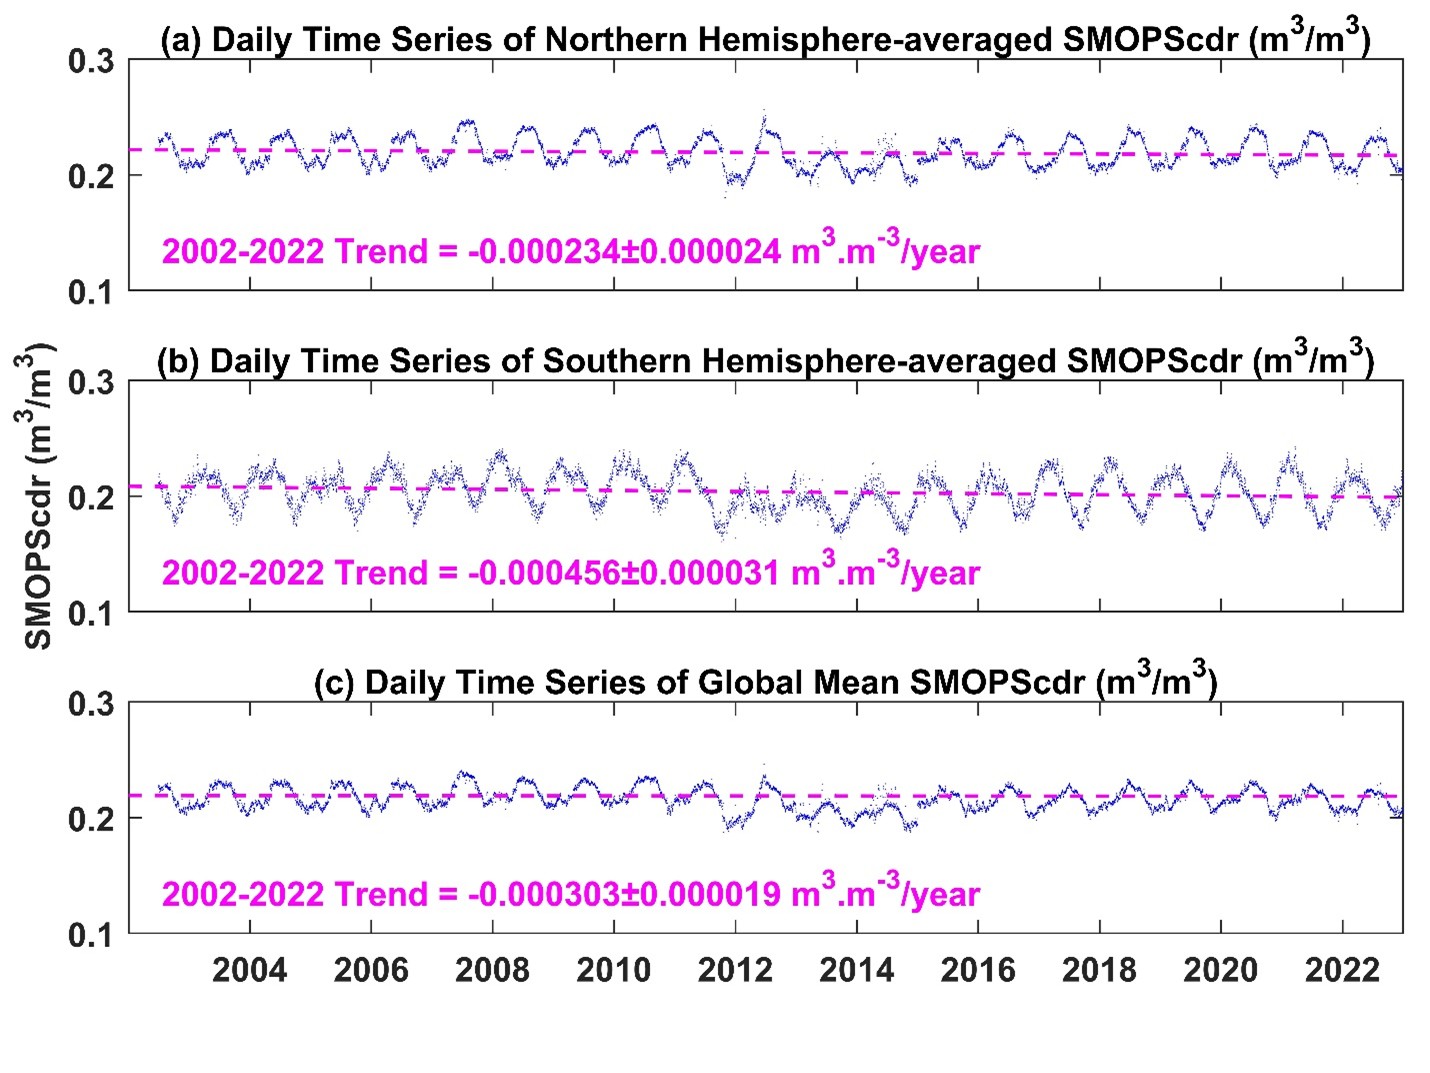
Daily time series of the averaged SMOPScdr soil moisture for (a) the Northern Hemisphere, (b) the Southern Hemisphere, and (c) the global domain from 2002 to 2022. A decreasing soil moisture trend is revealed, consistent with studies using different soil moisture products.
Given the enhanced data quality and spatiotemporal coverage, SMOPScdr is slated for integration to NOAA’s forecasting system, promising improved weather and climate forecasts. The debut version of SMOPScdr is already publicly available via the NOAA’s Comprehensive Large Array-data Stewardship System (CLASS), the file transfer protocol (FTP) site at NESDIS–Center for Satellite Applications and Research (STAR), and NOAA Office of Satellite and Product Operations.
")