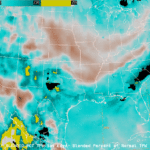
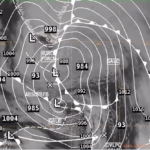
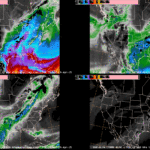
As the calendar flipped to Meteorological Spring, Mother Nature responded accordingly. A strong low pressure moved through the Central U.S. during the first work week of March, causing widepsread blowing dust, severe thunderstorms, and snowfall. The blowing dust started on 03 March 2025, as a potent upper-level low pushed east from the Intermountain West to the Central Plains. Fueled by the amplified upper-level trough, a surface low pressure intensified as it moved from the South-Central Plains to the Midwest. GOES-East Air Mass RGB imagery from 1810 UTC 04 March to 0600 UTC 05 March 2025 showcased the consolidating low pressure within an environment of dry-upper levels (red colors), suggesting ozone-rich stratospheric air with abundant amounts of potential vorticity (PV). By 1800 UTC 04 March 2025, the minimum central pressure of the extratropical cyclone was 980 mb.
Figure 1: GOES-East Full Disk Air Mass RGB imagery, valid 1810 UTC 04 March to 0600 UTC 05 March 2025. From CIRA Slider Figure 2: NWS Weather Prediction Center (WPC) Surface Analysis valid 0600 UTC 05 March 2025.

The strengthening low pressure yielded over 350 severe storm reports, according to the NWS Storm Prediction Center, before prompting Blizzard Warnings and dropping snow across the Central Plains and Upper Midwest. Clear skies on 06 March 2025 across the Upper Midwest allowed snow to be detected by the GOES-East CONUS Day Cloud Phase Distinction (DCPD) RGB. The green colors represent surfaces with high values of surface reflectance, or albedo, thanks to the fresh snow cover.
Figure 3: GOES-East CONUS DCPD RGB valid 1501 to 1821 UTC 06 March 2025. This video was exported from AWIPS, and display files can be shared upon request.
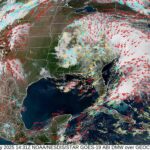
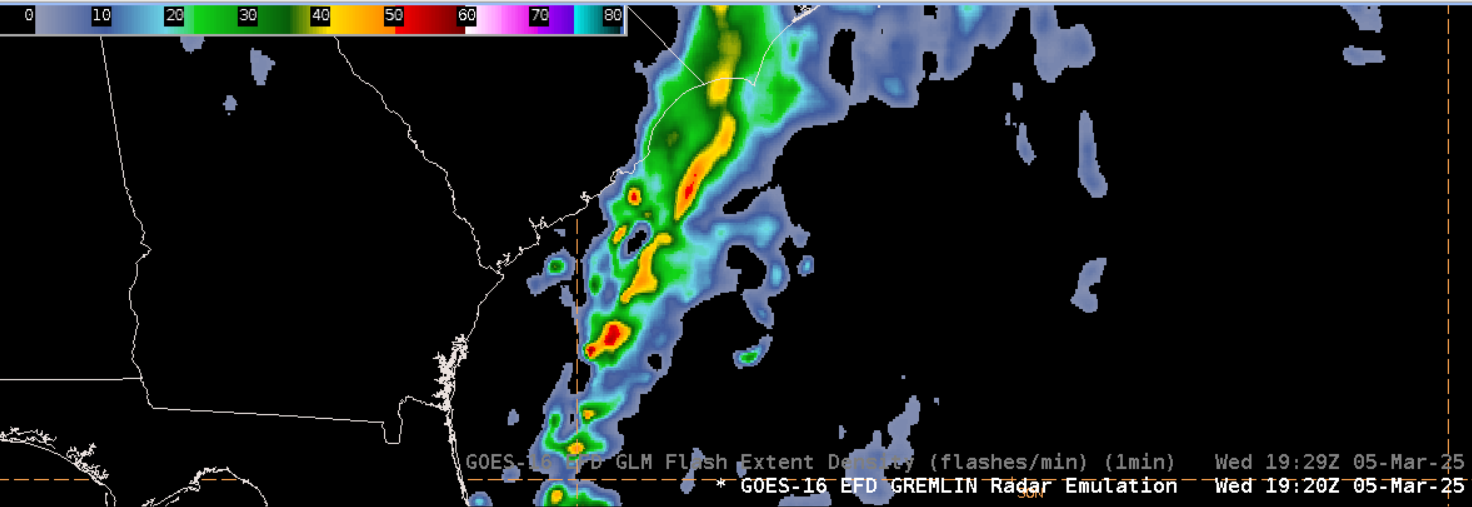
A strong cold front associated with the area of low pressure across the Upper Great Lakes pushed offshore during the afternoon of 05 March 2025, and the impacts shifted to the NWS Ocean Prediction Center (OPC) waters. NWS OPC NAVTEX Marine Forecast for southeast U.S. waters issued at 0308 UTC 05 March 2025 highlighted “South of 31N…WED…Tstms and scattered showers”. Indeed by the afternoon of Wednesday, 05 March, widespread thunderstorms were moving off the Southeast Coast, and even began to strengthen as they moved over the water. The GLM Flash Extent Density (FED) showed intense cells developing within the line of storms, noted by very high FED values. The GOES Radar Estimation via Machine Learning to Inform NWP (GREMLIN) Product provided a look at possible radar reflectivities associated with those stronger storms. GREMLIN performs better in areas with lots of lightning as the product was trained on the GLM Group Extent Density to match MRMS. Overlaying the GLM FED over GREMLIN confirmed the higher reflectivity values were located where lightning was abundant.
Figure 4: GOES-East LightningCast output overlaid on GLM FED and CONUS DCPD RGB imagery, valid 1636 to 2006 UTC 05 March 2025. This video was created in AWIPS, and display files can be shared upon request.

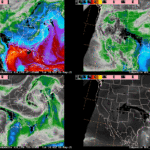
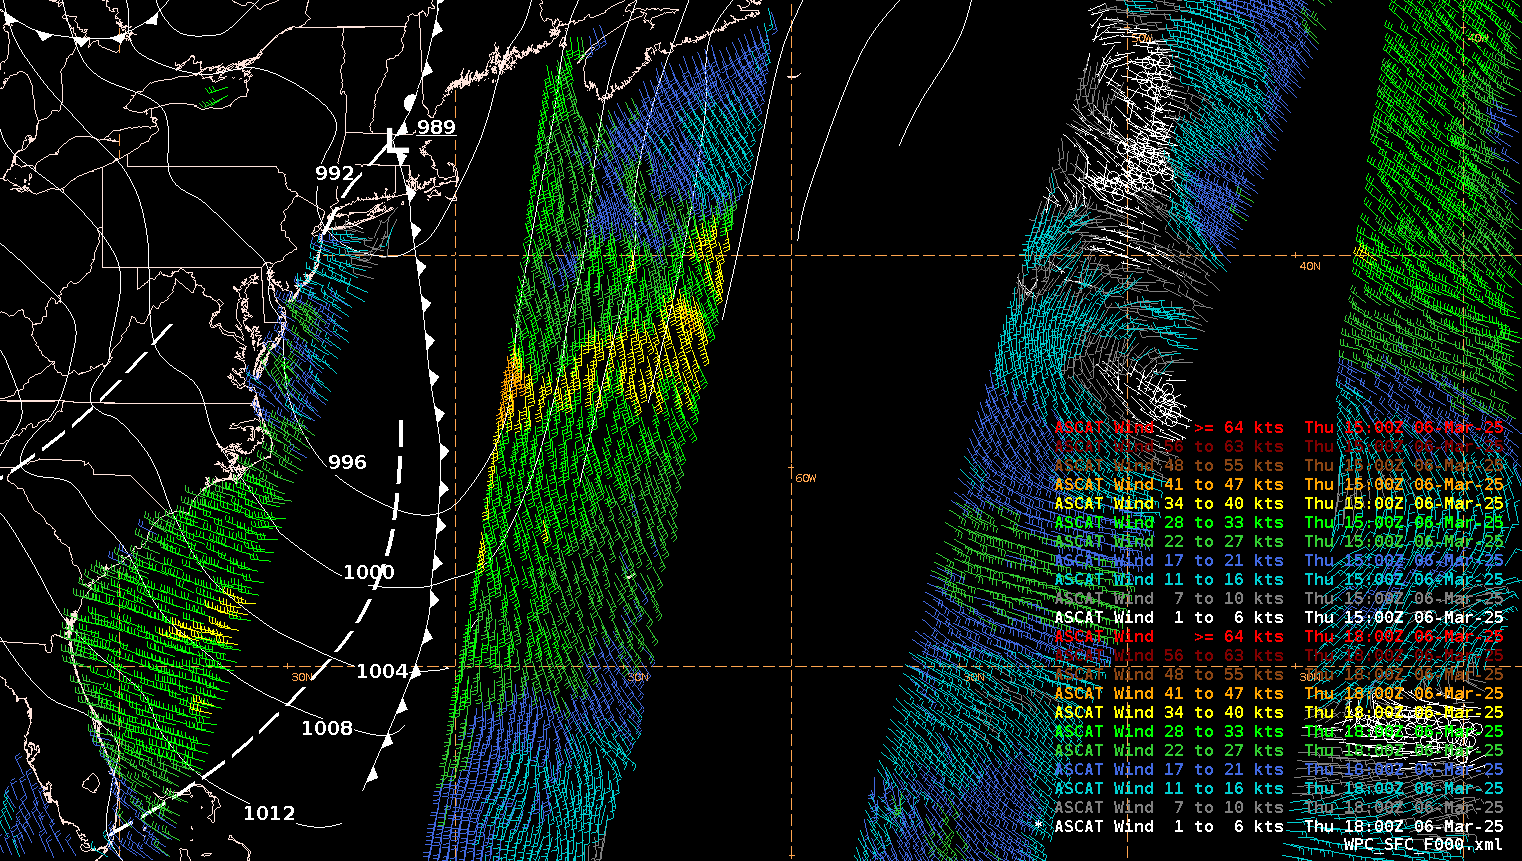
Due to the lack of observations over water, satellite observations such as those provided by scatterometry are extremely useful in aiding the identification of weather features for surface analyses. For example, Metop-B/ASCAT passes from ~1350 to ~1530 UTC 06 March 2025 were very useful in identifying the location of the cold front off the U.S. Eastern Seaboard with southerly winds ahead of the front shifting to the northwest behind. When paired with satellite imagery, the scatterometer winds greatly increase confidence in locating the cold front.
The early March storm system dropped up to 2 feet of snow in Michigan, while winds gusted above hurricane-force in Kansas, Nebraska, New Mexico, Oklahoma, and Texas, according to the NWS WPC Storm Summary.


