")
Headlines:
- La Nina rainfall anomaly pattern still holding on with RNino3.4 Index at -0.9K
- Flooding in southeast Africa, southern Europe and even New Zealand
- Snowfall in Rocky Mountains well below average
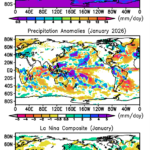
Although there has been some “westerly wind burst” activity over the Maritime Continent and extreme western Pacific that might portend the end of the La Nina and even a coming El Nino, the Relative Nino3.4 SST Index (RNino3.4, now the NOAA standard) for January still remained clearly in La Nina territory with a -0.9K value.
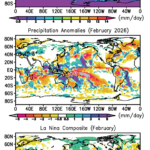
For the precipitation map for this January (Fig. 1, top panel) the strongest feature is the heavy rain area northeast of Australia and extending eastward south of the Equator. East of there the ITCZ barely exists along the Equator in the central and eastern Pacific this month. In the anomaly field (Fig. 1, middle panel) negative anomalies in the central/eastern Pacific and central Indican Ocean, both along the Equator, match with the composite La Nina map (Fig. 1, bottom panel). But the anomaly pattern over the Maritime Continent is very mixed and the negative values across the tropical Pacific are weaker and less continuous this month than in the January composite. These last traits may be the results of those westerly wind bursts.
Farther afield ENSO is still playing a role in rainfall disasters in Africa. Although rainfall deficits extend southward from the Horn of Africa, multiple floods in Mozambique and northeastern South Africa claimed hundreds of lives. And heavy rain in eastern Congo caused a landslide in an “unauthorized” mine causing 200 dead. Even farther afield was a tropical low event at the North Island of New Zealand with devastating landslides and flooding with daily rain totals of 250 mm. The La Nina composite shows a matching “expected” positive anomaly there.
For this January the U.S. was mostly dry somewhat matching the La Nina composite. Although California is now drought free, and January was overall dry, there was some flooding both in the southern and northern parts of the state. And the winter-time snow drought continued over the Rocky Mountains, with portions of the region (e.g., southwest Colorado) with 50% or less Snow Water Equivalent compared to normal. This obviously bodes ill for springtime runoff and water availability from the Colorado River. Over South America the northwest corner was wet, with its eastern half mostly dry. In central and southern Chile drought-associated wildfires caused serious destruction and 18 deaths.
Over Europe a positive rainfall anomaly runs from over the ocean west of Portugal, over Spain and continuing eastward over the Mediterranean into southern Italy. This feature was related to multiple cyclonic systems translating across the area producing copious rainfall and flooding, especially in southwest Spain and Sicily.
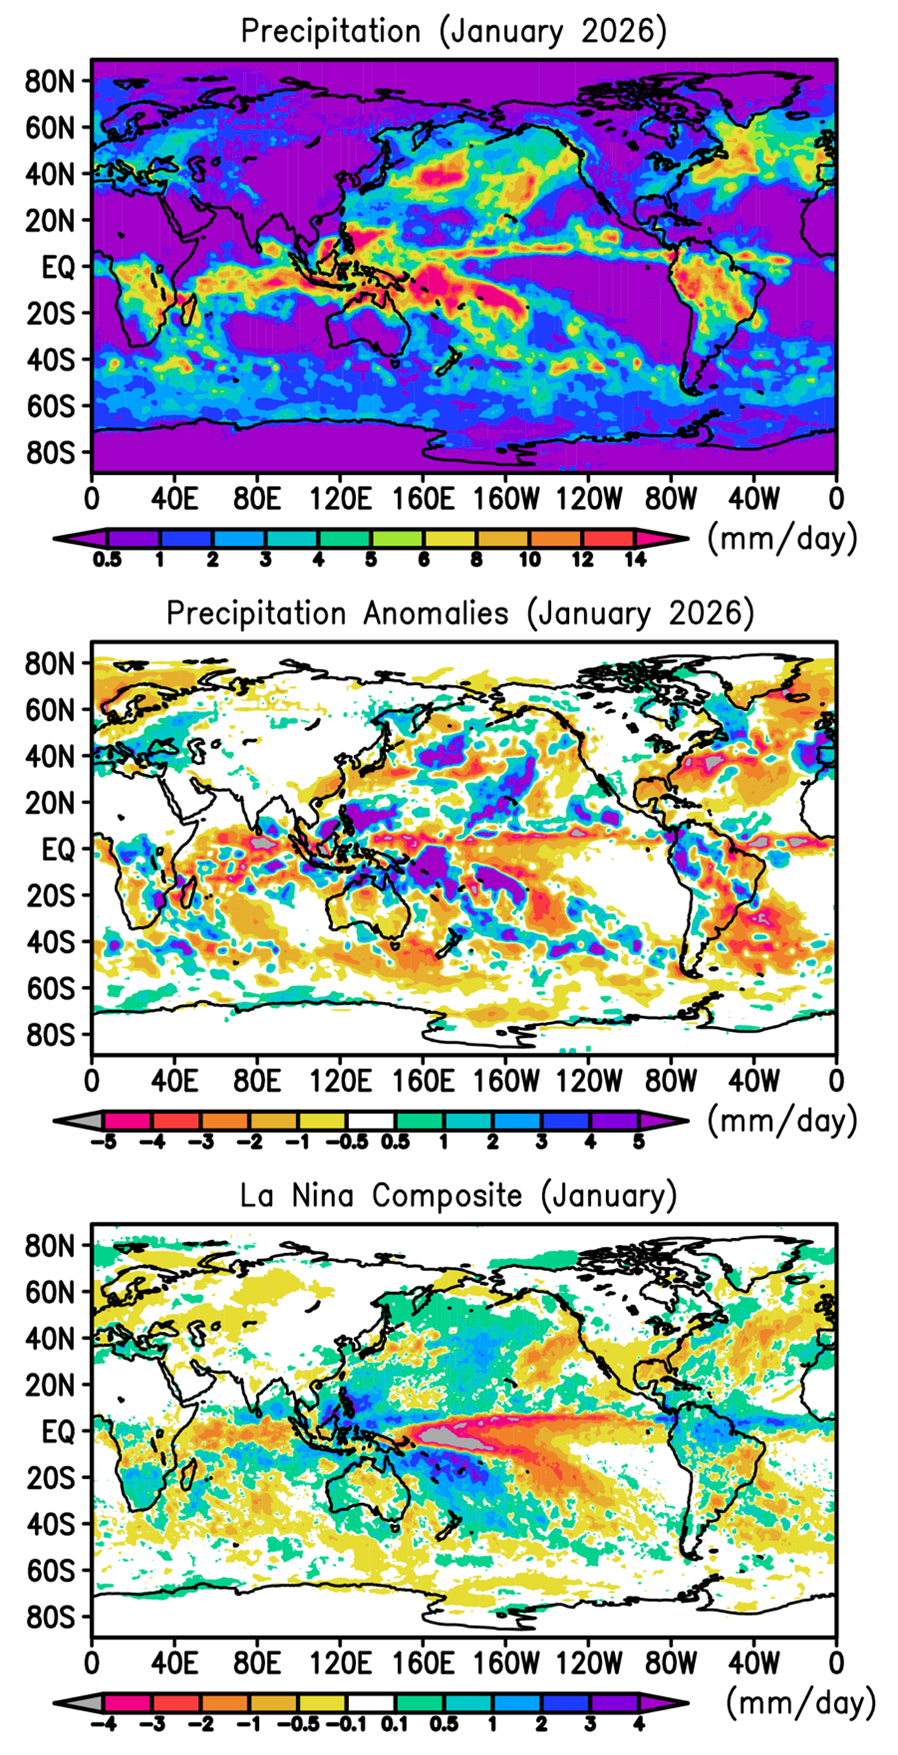
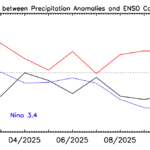
The overall anomaly pattern in the tropics is now has somewhat weaker La Nina features and the correlation between this January pattern and the January composite is now less than +0.2, lower than a few months ago (see Fig. 2).
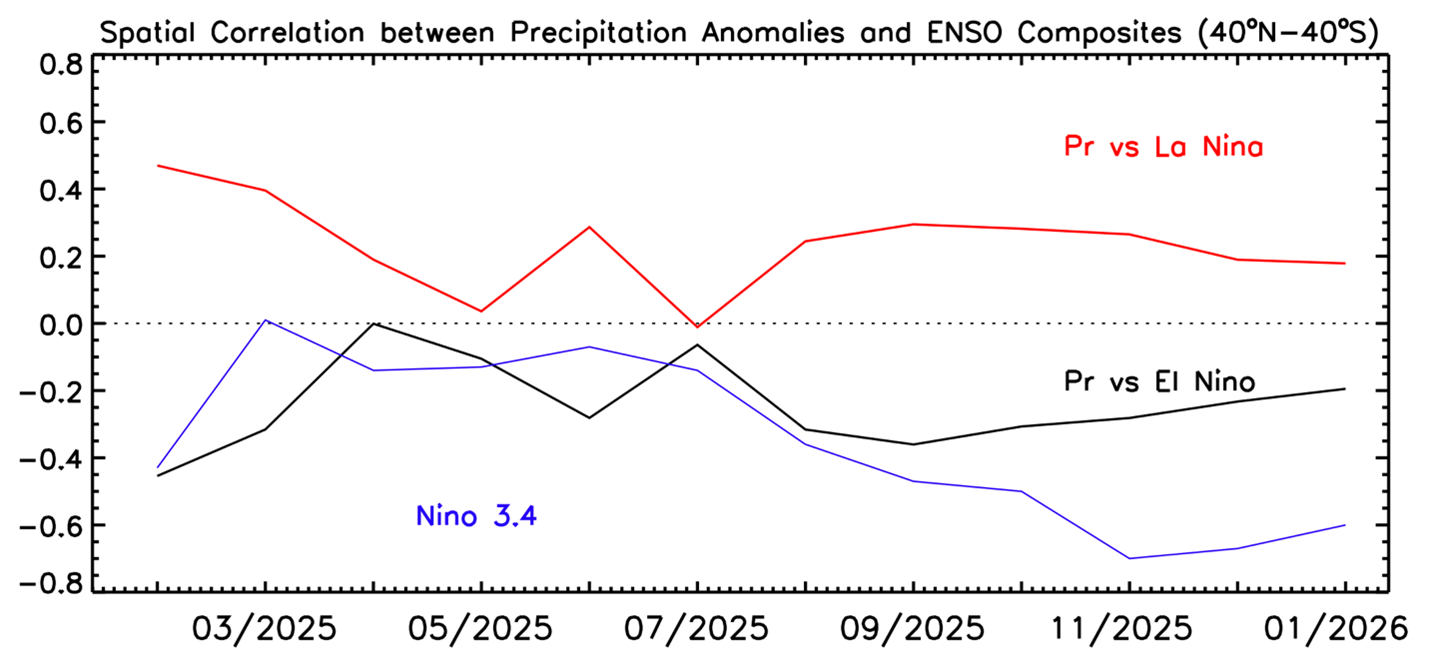
Table 1 gives the global totals for this January and shows the global total below the mean significantly, with the ocean total below its climatological mean as expected under La Nina conditions, but also the land value slightly below.
Table 1 Global precipitation and anomalies in January 2026.
| Mean Precipitation (January 1983-2025) | Precipitation (January 2026) | Precipitation anomaly (January 2026) |
Land+ocean | 2.81 | 2.68 | -0.13 |
Land | 2.11 | 2.04 | -0.07 |
Ocean | 3.11 | 2.96 | -0.15 |
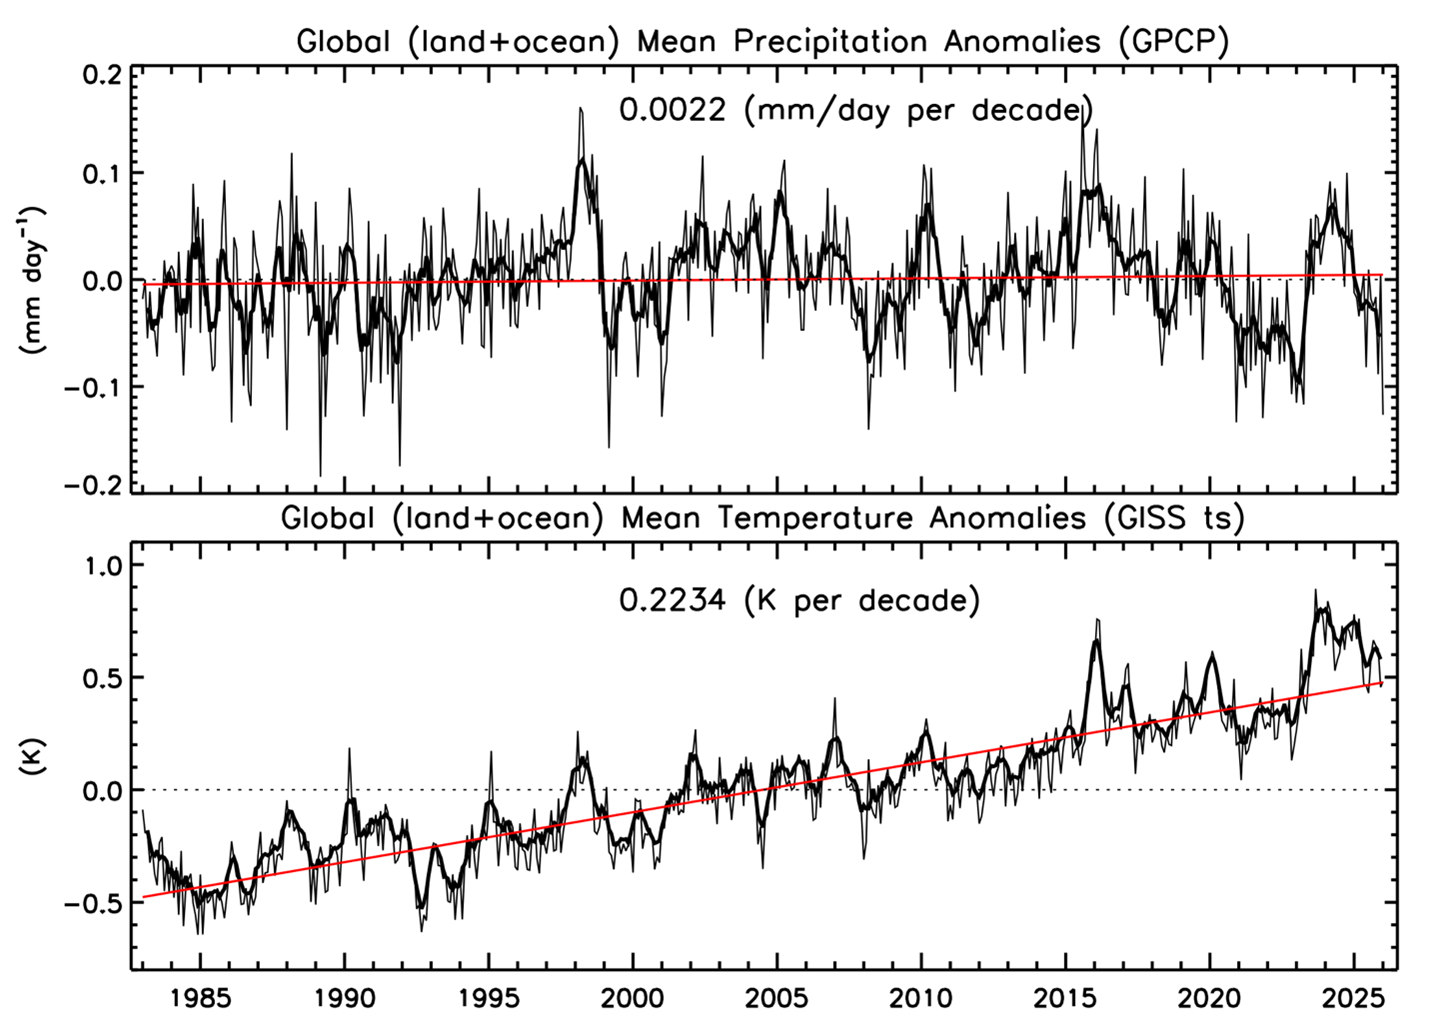
Fig. 3 continues shows an interesting feature of recent months in that while the monthly global precipitation number is well below the mean (La Nina), especially this January, the global surface temperature has remained above the fitted trend line that represents the global warming signal. The temperature anomaly from the trend line is usually highly correlated with the straight anomaly of global precipitation—compare the two curves. However, over the last year or so, while the global precipitation number was below the mean (typical of La Nina), the planet’s surface temperature is above the trend curve. This unusual relation carried over into January. Now as we likely move into a retreat from La Nina and move to neutral conditions and even a possible El Nino later in the year, should we expect new record high surface temperatures.
The Global Precipitation Climatology Project (GPCP)
This global precipitation summary is based on V3.2 of the Monthly Global Precipitation Climatology Project (GPCP) product, an observation based analysis using satellite observations over oceans and satellite and rain gauge observations over land. The Monthly analysis extends from 1983 to the near present as a Climate Data Record (CDR) with an extension to the previous month (within ~ 12 days of the end of the month) as an Interim CDR, or ICDR.
The development of the GPCP CDR products (Monthly and finer time scales) is supported by NASA’s MEaSUREs program. The GPCP Monthly ICDR was developed and its routine calculation is supported by NOAA’s National Center for Environmental Information (NCEI). GPCP products are available at NASA’s Goddard Earth Sciences Data and Information Services Center (GES DISC) and from NOAA NCEI.
The following references describe GPCP products in detail and provide additional research results using GPCP by the authors of this summary:
GPCP V3.2 paper:
Huffman, G. J. and R. Adler, A. Behrangi, D. Bolvin, E. Nelkin, G.Gu and M. Ehsani, 2023. The New Version 3.2 Global Precipitation Climatology Project (GPCP) Monthly and Daily Precipitation Products. J. Climate, 36, 7635- 7655. DOI: 10.1175/JCLI-D-23-0123.1.
GPCP V2.3 paper:
Adler, R., M. Sapiano, G. Huffman, J. Wang, G. Gu, D. Bolvin, L. Chiu, U. Schneider, A. Becker, E. Nelkin, P. Xie, R. Ferraro, D. Shin, 2018. The Global Precipitation Climatology Project (GPCP) Monthly Analysis (New Version 2.3) and a Review of 2017 Global Precipitation. Atmosphere. 9(4), 138; doi:10.3390/atmos9040138
Other references:Adler, R., G. Gu, M. Sapiano, J. Wang, G. Huffman 2017. Global Precipitation: Means, Variations and Trends During the Satellite Era (1979-2014). Surveys in Geophysics 38: 679-699, doi:10.1007/s10712-017-9416-4 Adler, R. F., G. Gu, G. J. Huffman, R. P. Sapiano and J. Wang, 2020: GPCP and the Global Characteristics of Precipitation. In Satellite Precipitation Measurement, Vol. 2, Chapter 35, 677-697. Advances in Global Change Research, 69, Springer Nature, doi:10.1007/978-3-030-35798-6_11.
Gu, G., and R. Adler, 2023. Observed Variability and Trends in Global Precipitation During 1979-2020. Climate Dynamics, 61, 131-150.
Adler, R. and G. Gu, 2024. Global Precipitation for the Year 2023 and How It Relates to Longer Term Variations and Trends. Atmosphere, 15(5). 10.3390/atmos15050535.
Gu, G. and R. Adler, 2024. Variability and Trends in Tropical Precipitation Intensity in Observations and Climate Models. Climate Dynamics, https://doi.org/10.1007/s00382-024-07287-y.