")
Headlines
Near-neutral July ENSO conditions associated with precipitation patterns somewhat resembling the global precipitation trend (1983-2024) pattern
Floods and landsides were associated with heavy rain in India and Ethiopia
Tropical cyclones led to flooding in Taiwan and Houston
July 2024 was the second hottest month all-time for global surface temperature (July 2023 has the record and it was an El Nino month). July is usually the hottest month globally in the annual cycle due to the majority of land being in the Northern Hemisphere. However, this July there was also a “heatwave” in most of Antarctica (during winter) to help boost the global temperature.
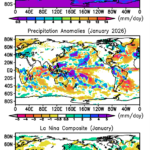
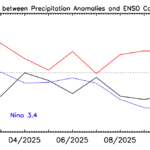
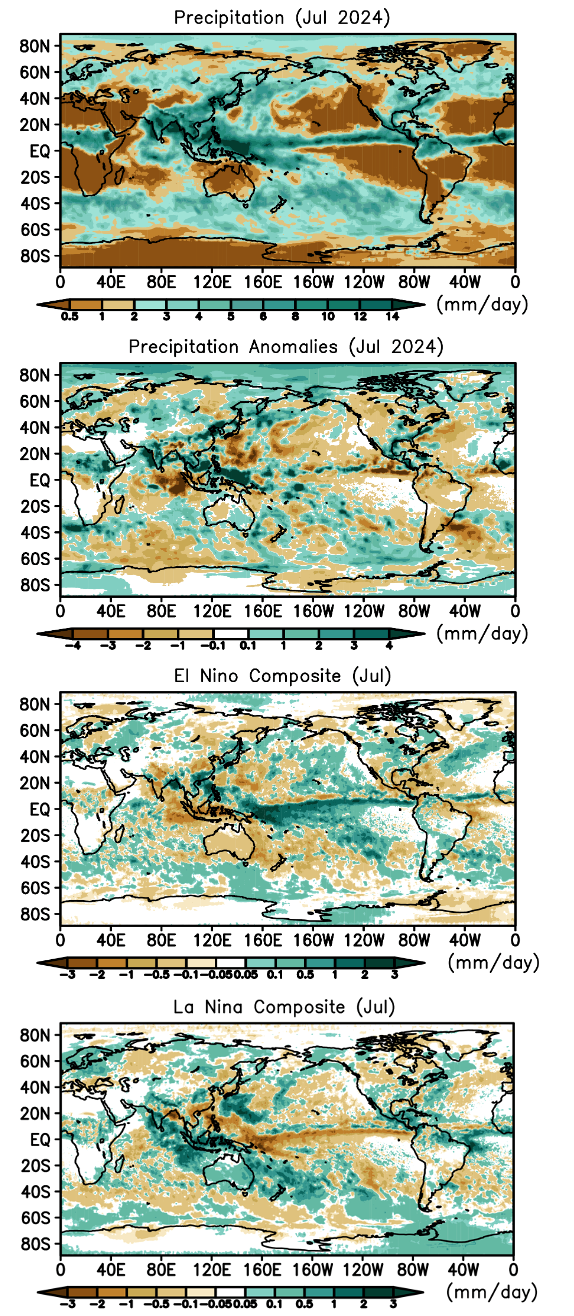
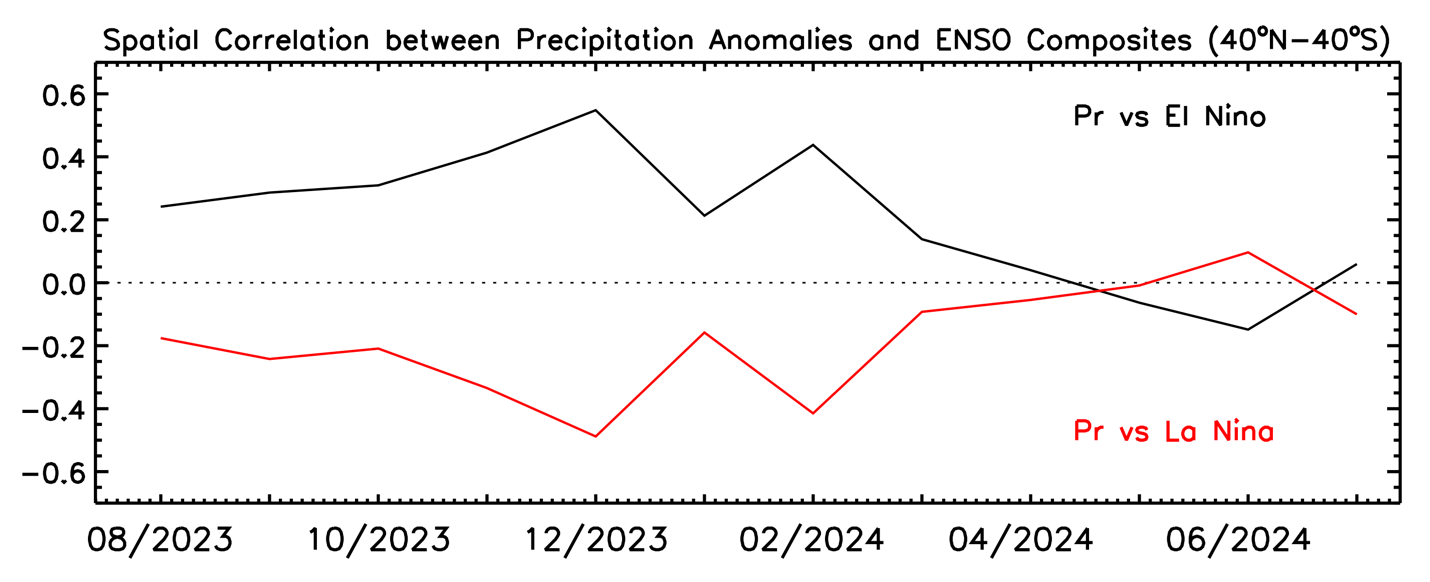
This July we were also in neutral ENSO conditions based on central Pacific Ocean SSTs, and the precipitation mean map for the month and the anomaly pattern (Fig. 1) show a strong South Asian Monsoon with heavy rain over the Indian and Indochina peninsulas, across the Philippines and into the western Pacific. The general positive anomaly over this large area might be thought of as consistent with a La Nina-type pattern, however a look at the ENSO composites for July (bottom two panels of Fig. 1), show it to be actually a little more like the El Nino composite pattern. The pattern correlation numbers (Fig. 2) between this July’s anomaly pattern and the ENSO composites have the correlations remaining near zero, indicating the lack of overall ENSO effect on precipitation patterns this month.
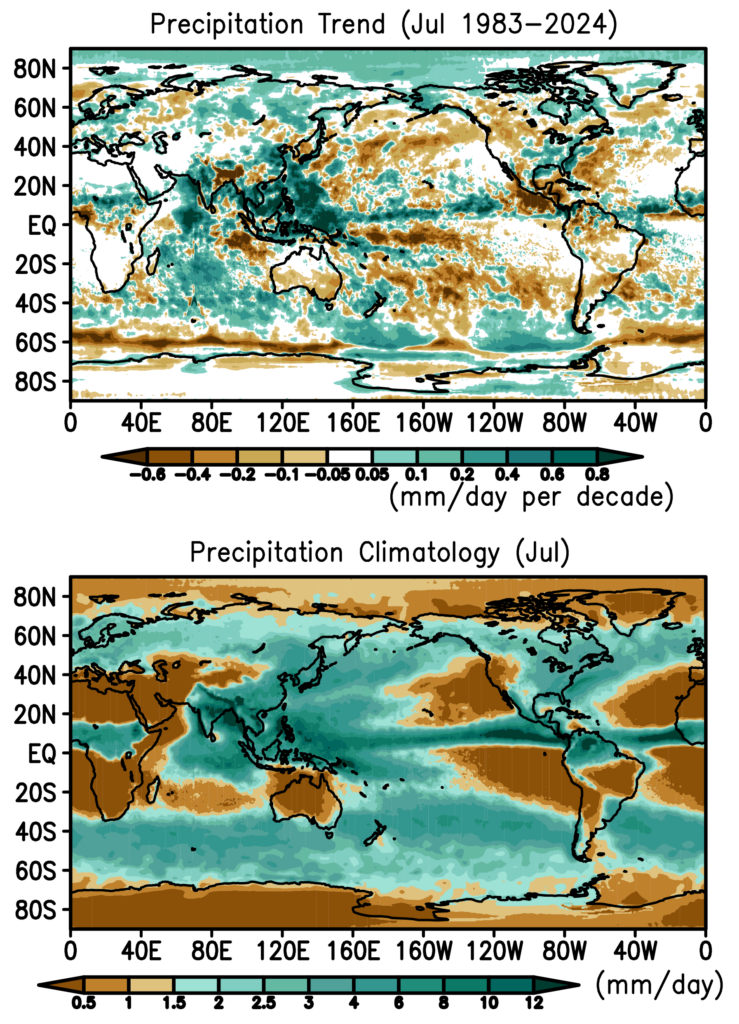
With the ENSO effect being very subdued, are the remaining anomaly patterns in Fig. 1 for this July due to something else or just random? Figure 3 shows the 1983-2024 trend pattern along with the climatology for July. Comparing this July’s anomaly pattern (Fig. 1, second panel) with the trend pattern (Fig. 3, top panel), one can discern some similarities. In fact, the spatial correlation (40°N-40°S) between the two fields is +0.28, not very big, but much bigger than the near zero ENSO effects this month (see Fig. 2). In other words, the effect of global warming is showing up (to some extent) in the July anomaly field, when it is not masked by ENSO effects.
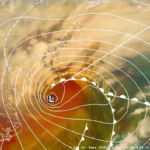
The very active South Asian monsoon provided a wealth of rainfall to the Asian region, with associated occurrences of floods and landslides. This included the effects of an early season tropical cyclone, Typhoon Gaemi, which flooded parts of the Philippine islands, before tracking over Taiwan and into China and then affecting North Korea late in the month. Taiwan had a peak rainfall of over 1000 mm. Over 100 deaths were recorded due to the storm. Even before Gaemi, northeastern China had a bout of flooding early in the month. India also had above average July rainfall, with the state of Kerala along the southwest coast suffering landslides and floods with over 100 dead.
Africa also shows an active band of rainfall with an above-normal east-west feature across the continent centered at about 15°N. At the east end of that feature, landslides killed over 200 in Ethiopia.
The Atlantic hurricane season is just beginning and early in the month the second named storm, Beryl, hit Jamaica, crossed the Yucatan Peninsula into the Gulf of Mexico and hit Texas causing significant flooding in Houston and knocking out power there for over a week. And its remnants even caused flooding in Vermont a couple of days later. On the monthly scale Beryl helped to provide the positive rainfall anomaly across the southeast U.S., although the Mid-Atlantic states (e.g., Maryland) were tending toward drought this month. In the western U.S. conditions were dry, with below normal rainfall, and there were a number of wildfires, e.g., in Oregon, California and Colorado, and also in western Canada. Drought conditions extended into eastern Canada. The patterns across North America this month match up positively with that indicated by the trend map in Fig. 3.
Over western Europe moderate conditions prevailed, but with negative rain anomalies extending from southeastern Europe northeastward above the Black Sea into northern Eurasia. South America was covered almost completely by negative anomalies.
Table 1 gives the global totals for the month and indicates a slight global positive anomaly, and a relatively big contribution to that from the land areas.
Table 1 Global precipitation and anomalies in July 2024.
| Mean Precipitation (July 1983-2023) | Precipitation (July 2024) | Precipitation anomaly (July 2024) |
Land+ocean | 2.87 | 2.93 | +0.07 |
Land | 2.49 | 2.69 | +0.20 |
Ocean | 3.02 | 3.04 | +0.01 |