")
Headlines
- Floods and landslides in South Asia kill 1300 related to tropical cyclones and La Nina
- The La Nina continues to affect the rainfall pattern from the Middle East to the central
Pacific - Iran faces severe water shortage exacerbated by drought associated with ongoing La Nina
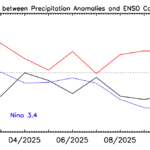
Even as the Asian Monsoon continues to retreat southward and rain begins to reach northern Australia (Fig. 1, top panel), the ongoing weak La Nina strengthened slightly in November (Nino 3.4 Index lowered to -0.7K and Relative Index to -1.0K). The La Nina helped produce a very active and deadly tropical cyclone month of November over the South China Sea and Bay of Bengal. A number of storms in various places produced extremely heavy rains, floods and landslides that ended November with an overall death toll of 1300 and huge destruction of infrastructure in a number of locations.
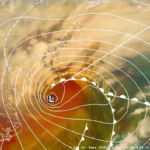
Early in the month Typhoon Kalmaegi hit the Philippine Islands causing about 100 deaths, crossed the South China Sea and hit Vietnam. About a week later the Philippines were hit again by a second typhoon that recurved and hit southern China and Taiwan. Later in the month landslides and floods in central Vietnam killed 40 related to a weak tropical system that came ashore with estimated rainfall of over 400 mm. Even south of the Equator TC Fina skirted along the northern coast of Australia with heavy rain and flooding.
In the last week of the month TS Koto generated east of the Philippines, traversed across the southern part of the country and crossed the South China Sea and hovered just off of Vietnam with heavy rain in coastal regions. Additional, relatively weak (from a wind standpoint) but heavily raining, tropical cyclones finished the month causing flooding and landslides in southern Thailand and the island of Sumatra (TC Senyar), and also Sri Lanka (TC Ditwah). It should be noted that all this heavy rainfall and tropical cyclone activity was accompanied by SSTs in the South China Sea 1-3C above average, helping to provide additional moisture for these systems.
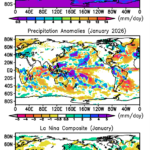
The global anomaly map (Fig. 1, middle panel) reflects all this rainfall and its effects over the South Asia region with large positive anomalies across the region on both sides of the Equator from the eastern Indian Ocean into the western Pacific Ocean. To the east negative anomalies dominate the Pacific in the deep tropics, with a very narrow positive anomaly right along the ITCZ in general agreement with typical La Nina conditions (Fig. 1, bottom panel). And to the west, across the northwestern Indian Ocean into eastern Africa relatively dry conditions exist, with above normal rainfall in southern Africa. Even the pattern across China, Korea and Japan and the western Pacific seem to match.
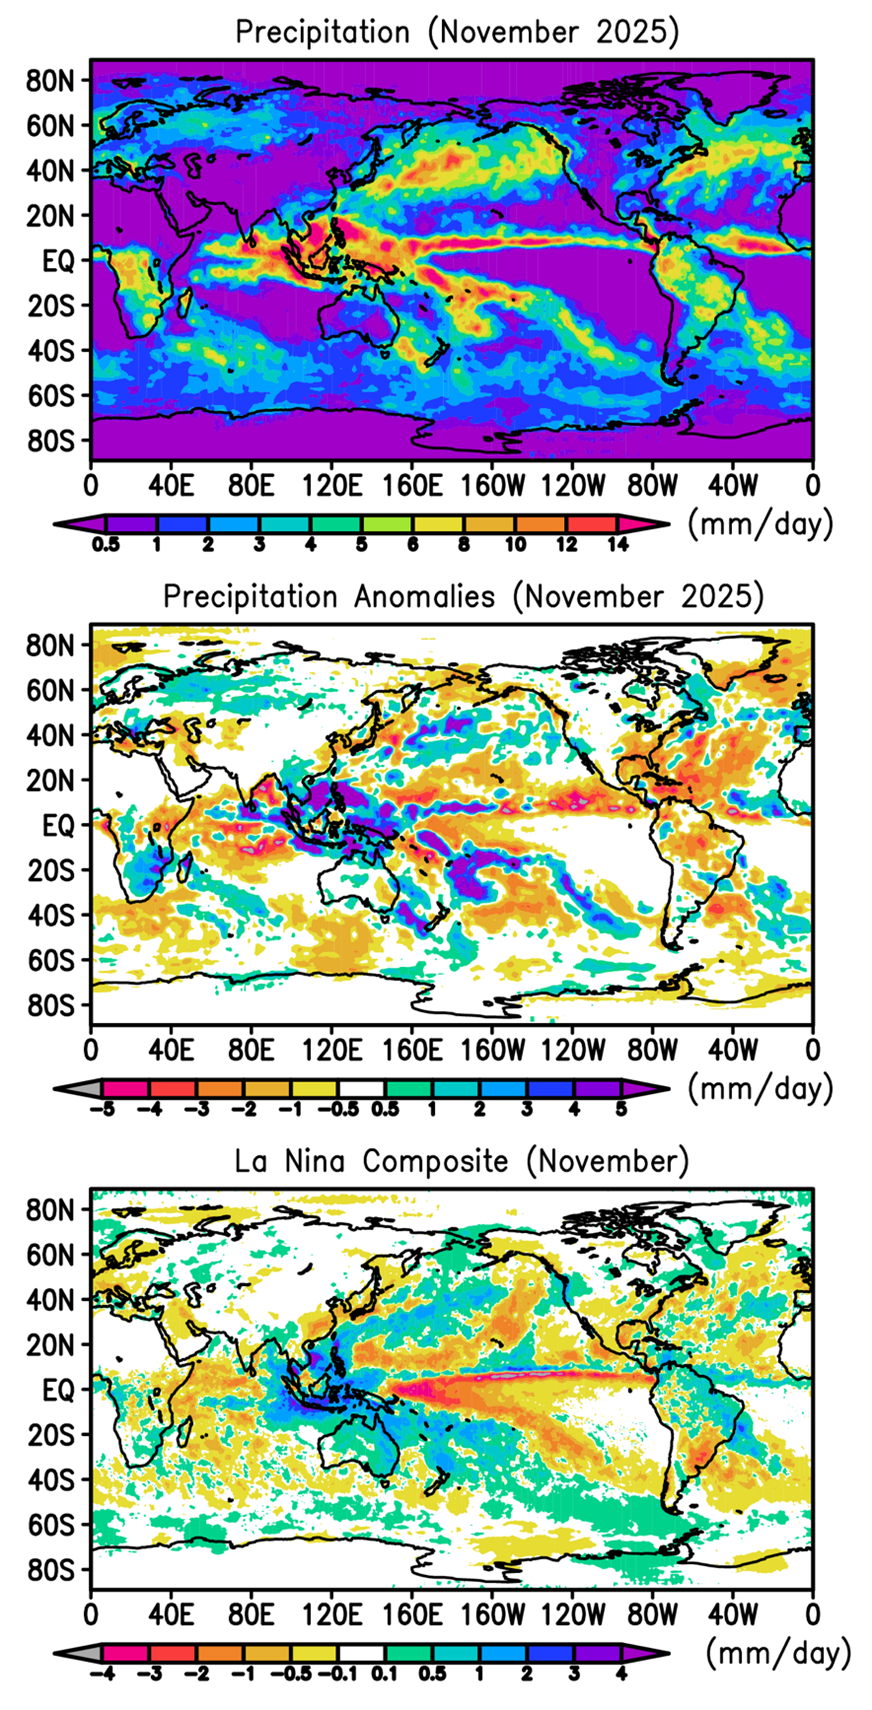
Further east the La Nina effect is still evident in both the North and South Pacific at midlatitudes. Over North America the pattern becomes more conflicted. The November anomaly map has North America covered by precipitation deficit except for California, therefore roughly La Nina-looking. Across the Atlantic heavy rain and flooding occurred in the middle of the month in the U.K. and Portugal, not connected to La Nina.
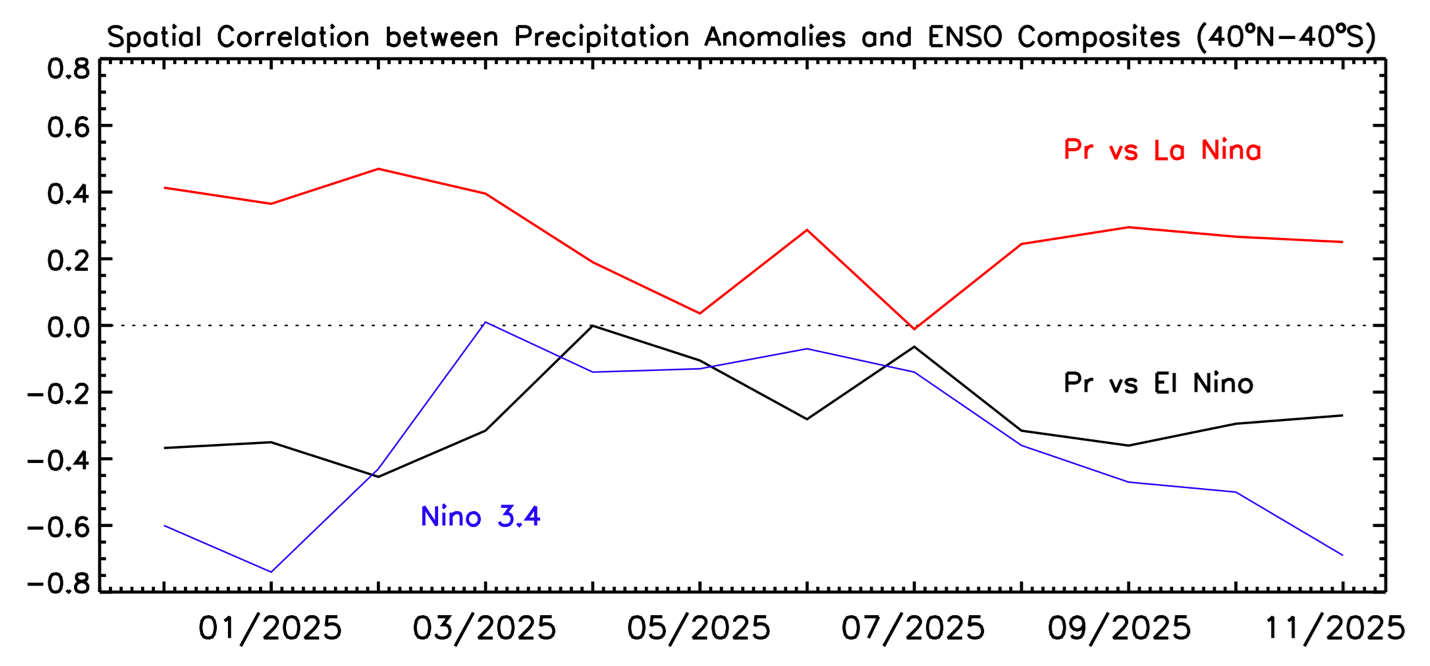
To finish the La Nina topic, the composite and this month’s anomalies both show a negative feature over the Middle East. Recent news has Iran suffering a major water shortage, primarily due to long-term overuse of both surface and sub-surface water supplies mainly for agricultural production. Global warming effects are also present in the region. However, the region has also been suffering a drought, due in part to the La Nina conditions over the past year. All these factors have led to empty reservoirs and water rationing. La Nina will end, but the other factors will not, leading to a potentially difficult longer-term result for Iran. The overall pattern correlation with the La Nina composite was still small and positive as in the last few months (Fig. 2).
Table 1: Global precipitation and anomalies in November 2025.
|
|
Mean Precipitation (November 1983-2024) |
Precipitation (November 2025) |
Precipitation anomaly (November 2025) |
|
Land+ocean |
2.80 |
2.71 |
-0.09 |
|
Land |
2.05 |
2.02 |
-0.03 |
|
Ocean |
3.11 |
2.99 |
-0.12 |
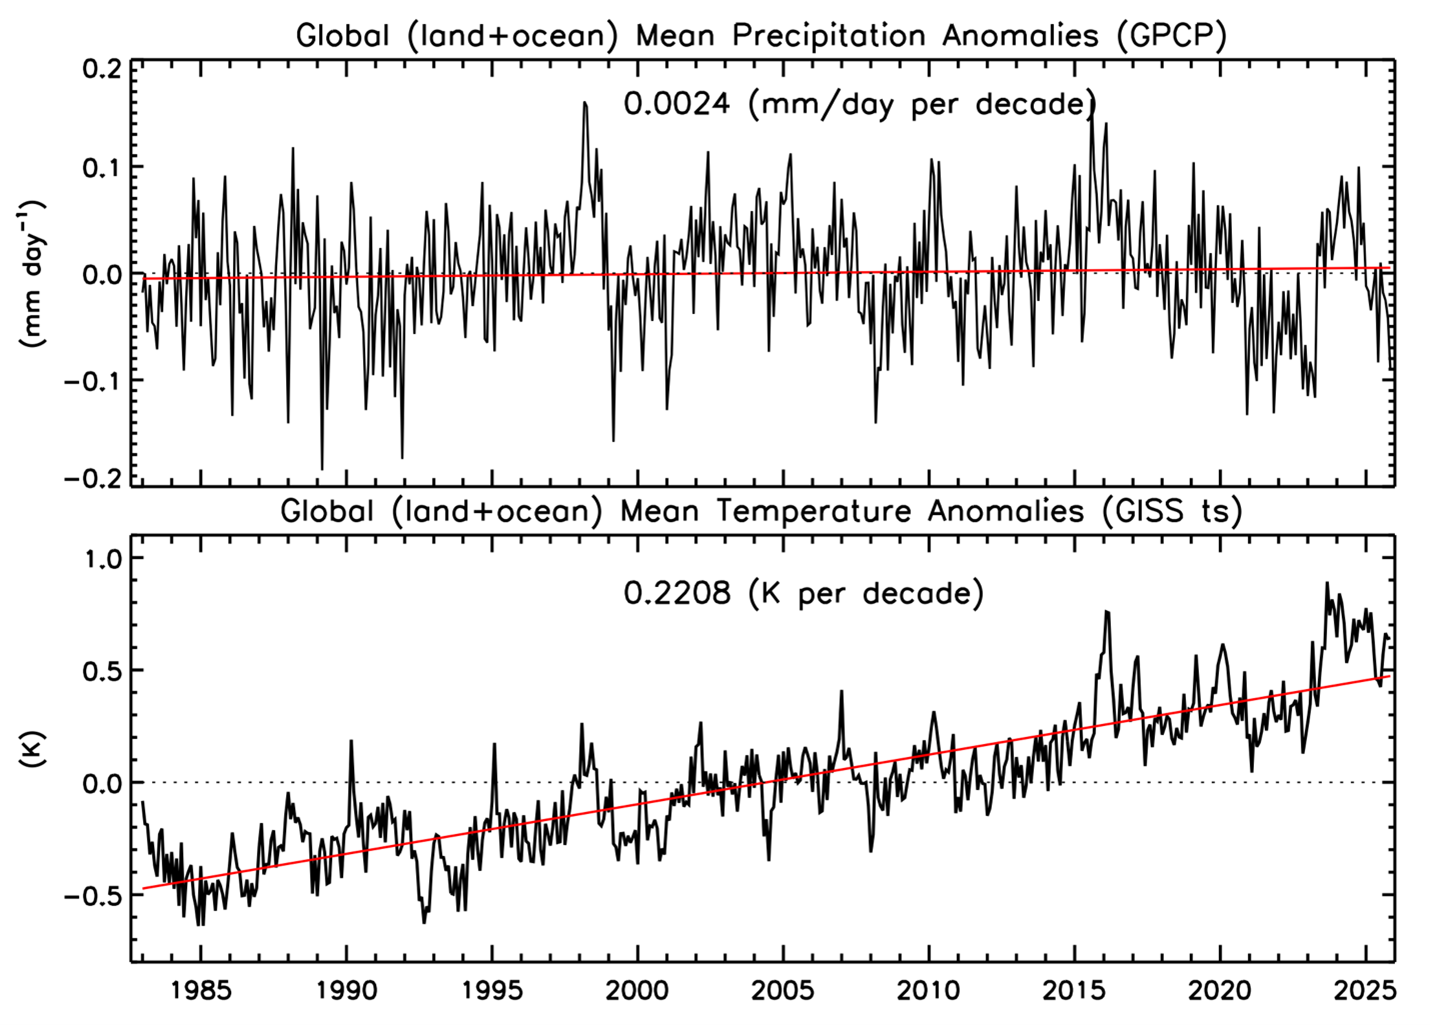
Table 1 has this month’s global anomalies and as expected under La Nina conditions the ocean total is below the long-term mean, but this month so is the land total, bringing the global total definitely below the mean, while the global surface temperature anomaly is back up higher than the long-term global warming trend line (Fig. 3).
The Global Precipitation Climatology Project (GPCP)
This global precipitation summary is based on V3.2 of the Monthly Global Precipitation Climatology Project (GPCP) product, an observation based analysis using satellite observations over oceans and satellite and rain gauge observations over land. The Monthly analysis extends from 1983 to Near Present as a Climate Data Record (CDR) with an extension to the previous month (within ~ 12 days of the end of the month) as an Interim CDR, or ICDR.
The development of the GPCP CDR products (Monthly and finer time scales) is supported by NASA’s MEaSUREs program. The GPCP Monthly ICDR was developed and its routine calculation is supported by NOAA’s National Center for Environmental Information (NCEI). GPCP products are available at NASA’s Goddard Earth Sciences Data and Information Services Center (GES DISC) and from NOAA NCEI.
The following references describe GPCP products in detail and provide additional research results using GPCP by the authors of this summary:
GPCP V3.2 paper:
Huffman, G. J. and R. Adler, A. Behrangi, D. Bolvin, E. Nelkin, G.Gu and M. Ehsani, 2023. The New Version 3.2 Global Precipitation Climatology Project (GPCP) Monthly and Daily Precipitation Products. J. Climate, 36, 7635- 7655. DOI: 10.1175/JCLI-D-23-0123.1.
GPCP V2.3 paper:
Adler, R., M. Sapiano, G. Huffman, J. Wang, G. Gu, D. Bolvin, L. Chiu, U. Schneider, A. Becker, E. Nelkin, P. Xie, R. Ferraro, D. Shin, 2018. The Global Precipitation Climatology Project (GPCP) Monthly Analysis (New Version 2.3) and a Review of 2017 Global Precipitation. Atmosphere. 9(4), 138; doi:10.3390/atmos9040138
Other references:Adler, R., G. Gu, M. Sapiano, J. Wang, G. Huffman 2017. Global Precipitation: Means, Variations and Trends During the Satellite Era (1979-2014). Surveys in Geophysics 38: 679-699, doi:10.1007/s10712-017-9416-4 Adler, R. F., G. Gu, G. J. Huffman, R. P. Sapiano and J. Wang, 2020: GPCP and the Global Characteristics of Precipitation. In Satellite Precipitation Measurement, Vol. 2, Chapter 35, 677-697. Advances in Global Change Research, 69, Springer Nature, doi:10.1007/978-3-030-35798-6_11.
Gu, G., and R. Adler, 2023. Observed Variability and Trends in Global Precipitation During 1979-2020. Climate Dynamics, 61, 131-150.
Adler, R. and G. Gu, 2024. Global Precipitation for the Year 2023 and How It Relates to Longer Term Variations and Trends. Atmosphere, 15(5). 10.3390/atmos15050535.
Gu, G. and R. Adler, 2024. Variability and Trends in Tropical Precipitation Intensity in Observations and Climate Models. Climate Dynamics, https://doi.org/10.1007/s00382-024-07287-y.