Following the hurricane’s rapid intensification, Erin brought dangerous surf and coastal flooding to the East Coast over the last several days before undergoing an impressive extratropical transition. On 20 August 2025, Erin remained a Category 2 hurricane as it pushed NNW and maintained a small eye in visible imagery around ~1230 UTC. A SWOT altimeter pass showcased the large area of hazardous seas with wave heights in excess of 25 feet across a large swath of Erin’s eastern quadrants.

Erin restrengthened to a strong Category 2 hurricane with maximum sustained winds of 110 mph at 1500 UTC 20 August 2025. GOES-East CONUS 5-minute “Clean” IR Longwave Window Band imagery from ~0850 UTC to ~1400 UTC 20 August 2025 showed the clearing of the hurricane’s eye as it pushed northward.
Figure 2: GOES-East CONUS Band 13 IR imagery from ~0850 to ~1400 UTC 20 August 2025. This video was created from AWIPS, and display files can be shared upon request.
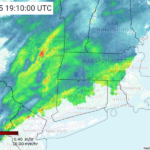
The NWS Ocean Prediction Center’s (OPC) NAVTEX Marine Forecast for southeast U.S. waters issued at 0920 20 August 2025 forecasted “Showers and tstms with vsby 1 nm or less.” GOES Radar Estimation via Machine Learning to Inform NWP (GREMLIN) product output at 1530 UTC depicted showers were indeed ongoing across much of the region, with an eye-like feature visible near Erin’s center.


A NWS Weather Prediction Center (WPC) meteorologist noted subsidence in the Day Cloud Phase RGB on 20 August 2025, as thick water clouds with large droplets (pink colors) quickly eroded across the Mid Atlantic as thick clouds with ice particles (blue colors) pushed northward at the edge of Hurricane Erin’s cloud field.

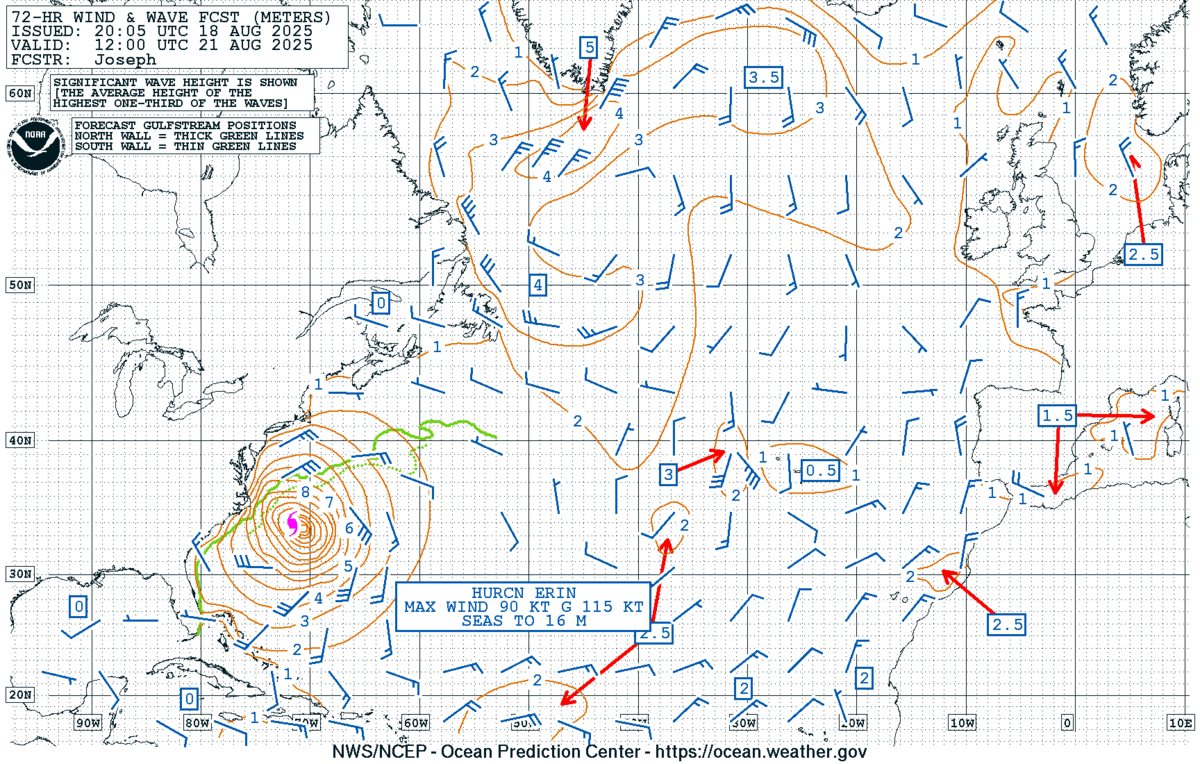
The NWS OPC 72 Hour Wind and Wave Forecast valid at 1200 UTC 21 August 2025 predicted significant wave heights, or the average height of the highest one-third of the waves, of 5 to 6 meters, or roughly 16 to 20 feet, near the Outer Banks of North Carolina, with 3 meter seas (roughly 10 foot waves) up the coast towards New Jersey.
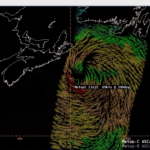
A Sentinel-3B altimeter pass at ~0300 UTC 21 2025 August confirmed wave heights in excess of 15 ft just south of the Outer Banks, while a drifting Sofar buoy observed wave heights in excess of 44 feet closer to the center of Hurricane Erin. A Metop-B ASCAT slightly earlier also confirmed hurricane-force winds in excess of 64 kts in Erin’s eastern quadrants.


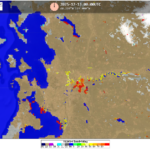
The persistent onshore flow provided by the large hurricane prompted Coastal Flood warnings across the Mid-Atlantic. 5-day VIIRS Flood Composite product output ending at 0000 UTC 23 August 2025 showed the impact of coastal flooding across the Delmarva Pensinula, with areas along the coastal bays and estuaries seeing an excess of 70 percent in flood water fractions (orange and red colors).

The NWS OPC 48-Hour Surface Forecast, valid at 1200 UTC 24 August 2025, predicted Erin to become a post-tropical hurricane-force low over the north-central Atlantic. GOES-East Full Disk Air Mass RGB imagery, filtered to have a 20-minute cadence, from 1200 UTC 22 August, when Erin was still a hurricane, to 0600 UTC 24 August 2025, captured the extratropical transition and reintensification of the system. About halfway through the animation, you can see a region of air with high levels of potential vorticity (noted by orange-red colors), sweeping east from Newfoundland before being infused into the system, allowing for its restrengthening. The minimum central pressure of the system dropped 18 hPa in 12 hours, from 970 hPa at 0000 UTC to 952 hPa at 1200 UTC 24 August 2025.
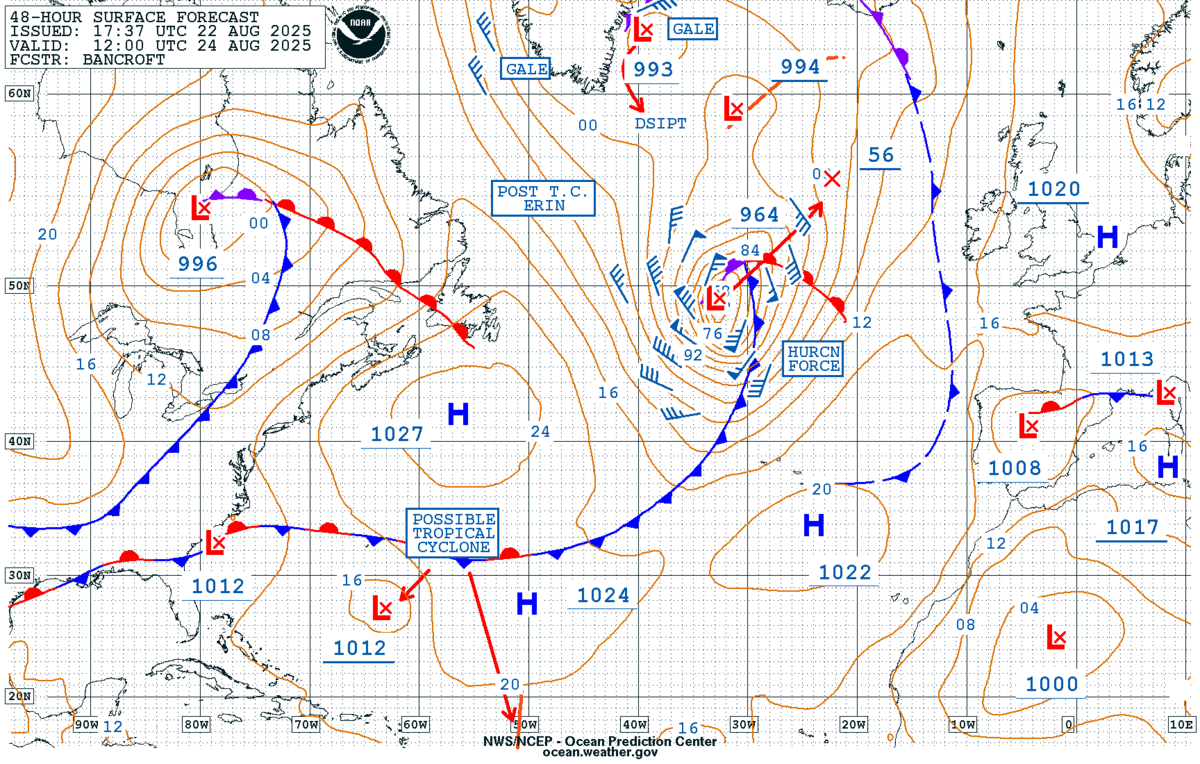
Figure 12: GOES-East Full Disk Airmass RGB imagery from ~1200 UTC 22 August to ~0600 UTC 24 August 2025, filtered to have a 20-minute cadence. From CIRA Slider
Figure 13 (2 parts, click to expand): NWS OPC Atlantic Surface Analysis at 0000 and 1200 UTC 24 August 2025.
A Metop-C ASCAT pass at ~1300 UTC 24 August 2025 confirmed hurricane-force winds in the low pressure’s southwestern quadrant, a key difference from tropical systems where the strongest winds tend to be in the northeast quadrant.

A SWOT altimeter pass early this morning confirmed that extremely large waves persist across the north-central Atlantic, with wave height observations in excess of 30 feet.

The NWS OPC provided Key Messages for this system to the U.S. Coast Guard and noted exceptional vessel avoidance as Erin brought large waves and strong winds just off the East Coast before undergoing an extratropical transition.


