The ocean has been absorbing about 25% of the carbon dioxide (CO2) emitted by human activities. As a result, the global ocean has become more acidic. From 2000 to 2100, pH is projected to decrease by 0.3–0.4 units (∼100%–150% increase in acidity) under the high-emission, low-mitigation Business-As-Usual Scenario (SSP5-8.5). This drastic change to the ocean’s chemistry could threaten large marine ecosystems (LMEs), coastal ocean regions that play an important role in the global carbon cycle and are home to economically-important fisheries and coral reefs.
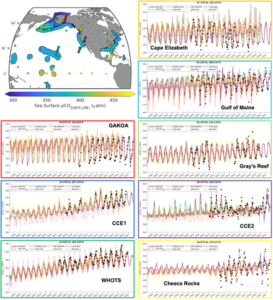
In a recent publication in the journal Scientific Data, ESSIC/CISESS Scientists Liqing Jiang, Paige Lavin, and Hyelim Yoo as well as colleagues from the University of Washington and NOAA/NESDIS National Centers for Environmental Information introduce mapped monthly data products of surface OA indicators from 1998 to 2022 on a 0.25° by 0.25° spatial grid for eleven LMEs in the U.S.
These data products, referred to as random forest regression LMEs (RFR-LMEs), were constructed using observations from the Surface Ocean CO2 Atlas, co-located surface ocean properties, and two types of machine-learning algorithms. Motivated by a partnership with the National Oceanic and Atmospheric Administration Ecosystem Indicators Working Group, who manage the National Marine Ecosystem Status (NaMES) website, the authors present their case of using their RFR-LMEs as NaMES indicators of OA. These kinds of indicator datasets are used by many NOAA stakeholders, such as fisheries managers, to monitor their ecosystems of interest and to assess the potential for future change.
Jiang is a chemical oceanographer specializing in the study of inorganic carbon cycling and ocean acidification in the global oceans. He received his Ph.D in Marine Sciences from the University of Georgia in 2009 and did his postdoctoral research at Yale University. Jiang has been working at NOAA’s National Centers for Environmental Information (NCEI) since 2011. Currently, he serves as the lead of the Ocean Carbon and Acidification Data System (OCADS), which is co-funded by NOAA’s Ocean Acidification Program, Global Ocean Monitoring and Observing Program, and NCEI. In addition to data management, Jiang spends a lot of his time on data synthesis efforts.
Lavin is a large-scale physical oceanographer who studies the ocean’s role in climate, especially through analyses of ocean heat content and sea level rise. Much of her recent work has involved blending in situ and satellite oceanographic datasets using machine learning methods. She received her Ph.D in Oceanography: Advanced Data Science from the University of Washington in 2021, along with a Graduate Certificate in Climate Science. Lavin currently works with NOAA’s Center for Satellite Applications and Research (STAR) as a postdoctoral research associate and is also a member of the NASA Ocean Surface Topography Science Team.
Yoo received her Ph.D in Atmospheric and Oceanic Science from University of Maryland in 2012 and has been with NOAA since 2012, and worked in support of NOAA ARL, STAR, and NCEI. Currently, as a member of the Ocean Climate Laboratory team at NCEI, Yoo works to ensure the public availability of specific data collected operationally by the Office of Marine and Aviation Operations (OMAO) aboard NOAA Fleet. Also, she supports establishing a mapped dataset of surface ocean acidification indicators in the U.S. Large Marine Ecosystems and to sustain operationalization based on their availability in the cloud environment, prioritizing NOAA-produced datasets. She is involved in the development of the Coastal Ocean Data Analysis Product in North America with a new set of quality control tools and acidification research by publishing their data into NCEI’s archives.
To access the publication, click here: “A mapped dataset of surface ocean acidification indicators in large marine ecosystems of the United States”.
")