ESSIC/CISESS scientists Yong-Keun Lee and Christopher Grassotti are co-authors on a new paper in Remote Sensing led by first author Zichao Liang, a student who interned with the MiRS team during the summer of 2023. NOAA scientists Lin Lin and Quanhua Liu also co-authored the paper. The paper, titled “Machine Learning-Based Estimation of Tropical Cyclone Intensity from Advanced Technology Microwave Sounder Using a U-Net Algorithm”, assesses the use of the U-Net model to estimate surface wind speed and surface pressure over pure ocean conditions.
The U-Net algorithm is an evolution of the traditional convolutional neural network (CNN) algorithm, designed to train using fewer images to produce more precise image segmentations. The team used the U-Net algorithm to retrieve surface pressure and wind speed over the ocean within tropical cyclones (TCs) and their neighboring areas using NOAA-20 Advanced Technology Microwave Sounder (ATMS) reprocessed Sensor Data Record (SDR) brightness temperatures (TBs) and geolocation information. For TC locations, International Best Track Archive for Climate Stewardship (IBTrACS) data have been used over the North Atlantic Ocean and West Pacific Ocean between 2018 and 2021. The European Centre for Medium-Range Weather Forecasts (ECMWF) Reanalysis v5 (ERA5) surface pressure and wind speed were employed as reference labels.
Preliminary results demonstrated that the visualizations for wind speed and pressure matched the prediction and ERA5 location. The residual biases and standard deviations between the predicted and reference labels were about 0.15 m/s and 1.95 m/s, respectively, for wind speed and 0.48 hPa and 2.67 hPa, respectively, for surface pressure, after applying cloud screening for each ATMS pixel. This indicates that the U-Net model is effective for surface wind speed and surface pressure estimates over pure ocean conditions.
To access the paper, click here: “Machine Learning-Based Estimation of Tropical Cyclone Intensity from Advanced Technology Microwave Sounder Using a U-Net Algorithm”.
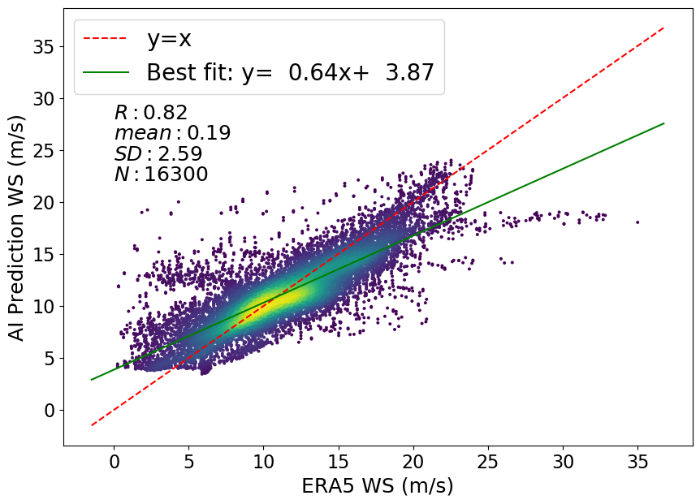
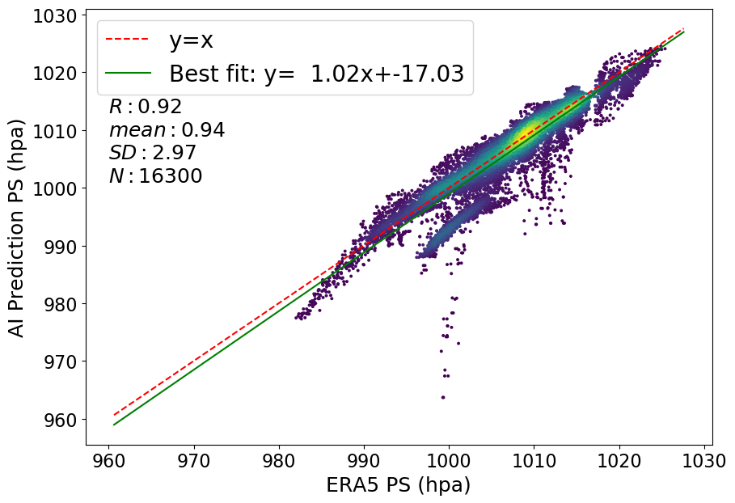
Figure 1. Scatterplots of U-Net prediction vs. ERA5 for (A) surface wind speed (m/s) and (B) surface pressure (hPa) across all 27 test samples. The pixels included in this analysis were selected from within a 350 km radius circle centered on the TC. The data distribution changes from dense to sparse as the color shifts from yellow to blue. (R: Pearson correlation coefficients; SD: standard deviation; N: number of selected pixels).

