
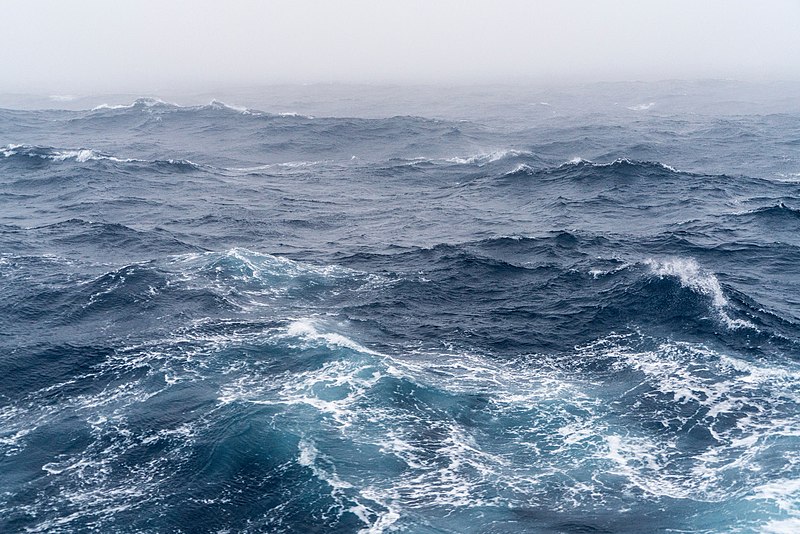
A Critical Ocean Current for Climate Regulation Is More Resilient Than Expected
by Alexey Mishonov The Atlantic Meridional Overturning Circulation (AMOC) is a vast ocean current system crucial for regulating the Earth’s climate, and it has been
")
by Alexey Mishonov The Atlantic Meridional Overturning Circulation (AMOC) is a vast ocean current system crucial for regulating the Earth’s climate, and it has been
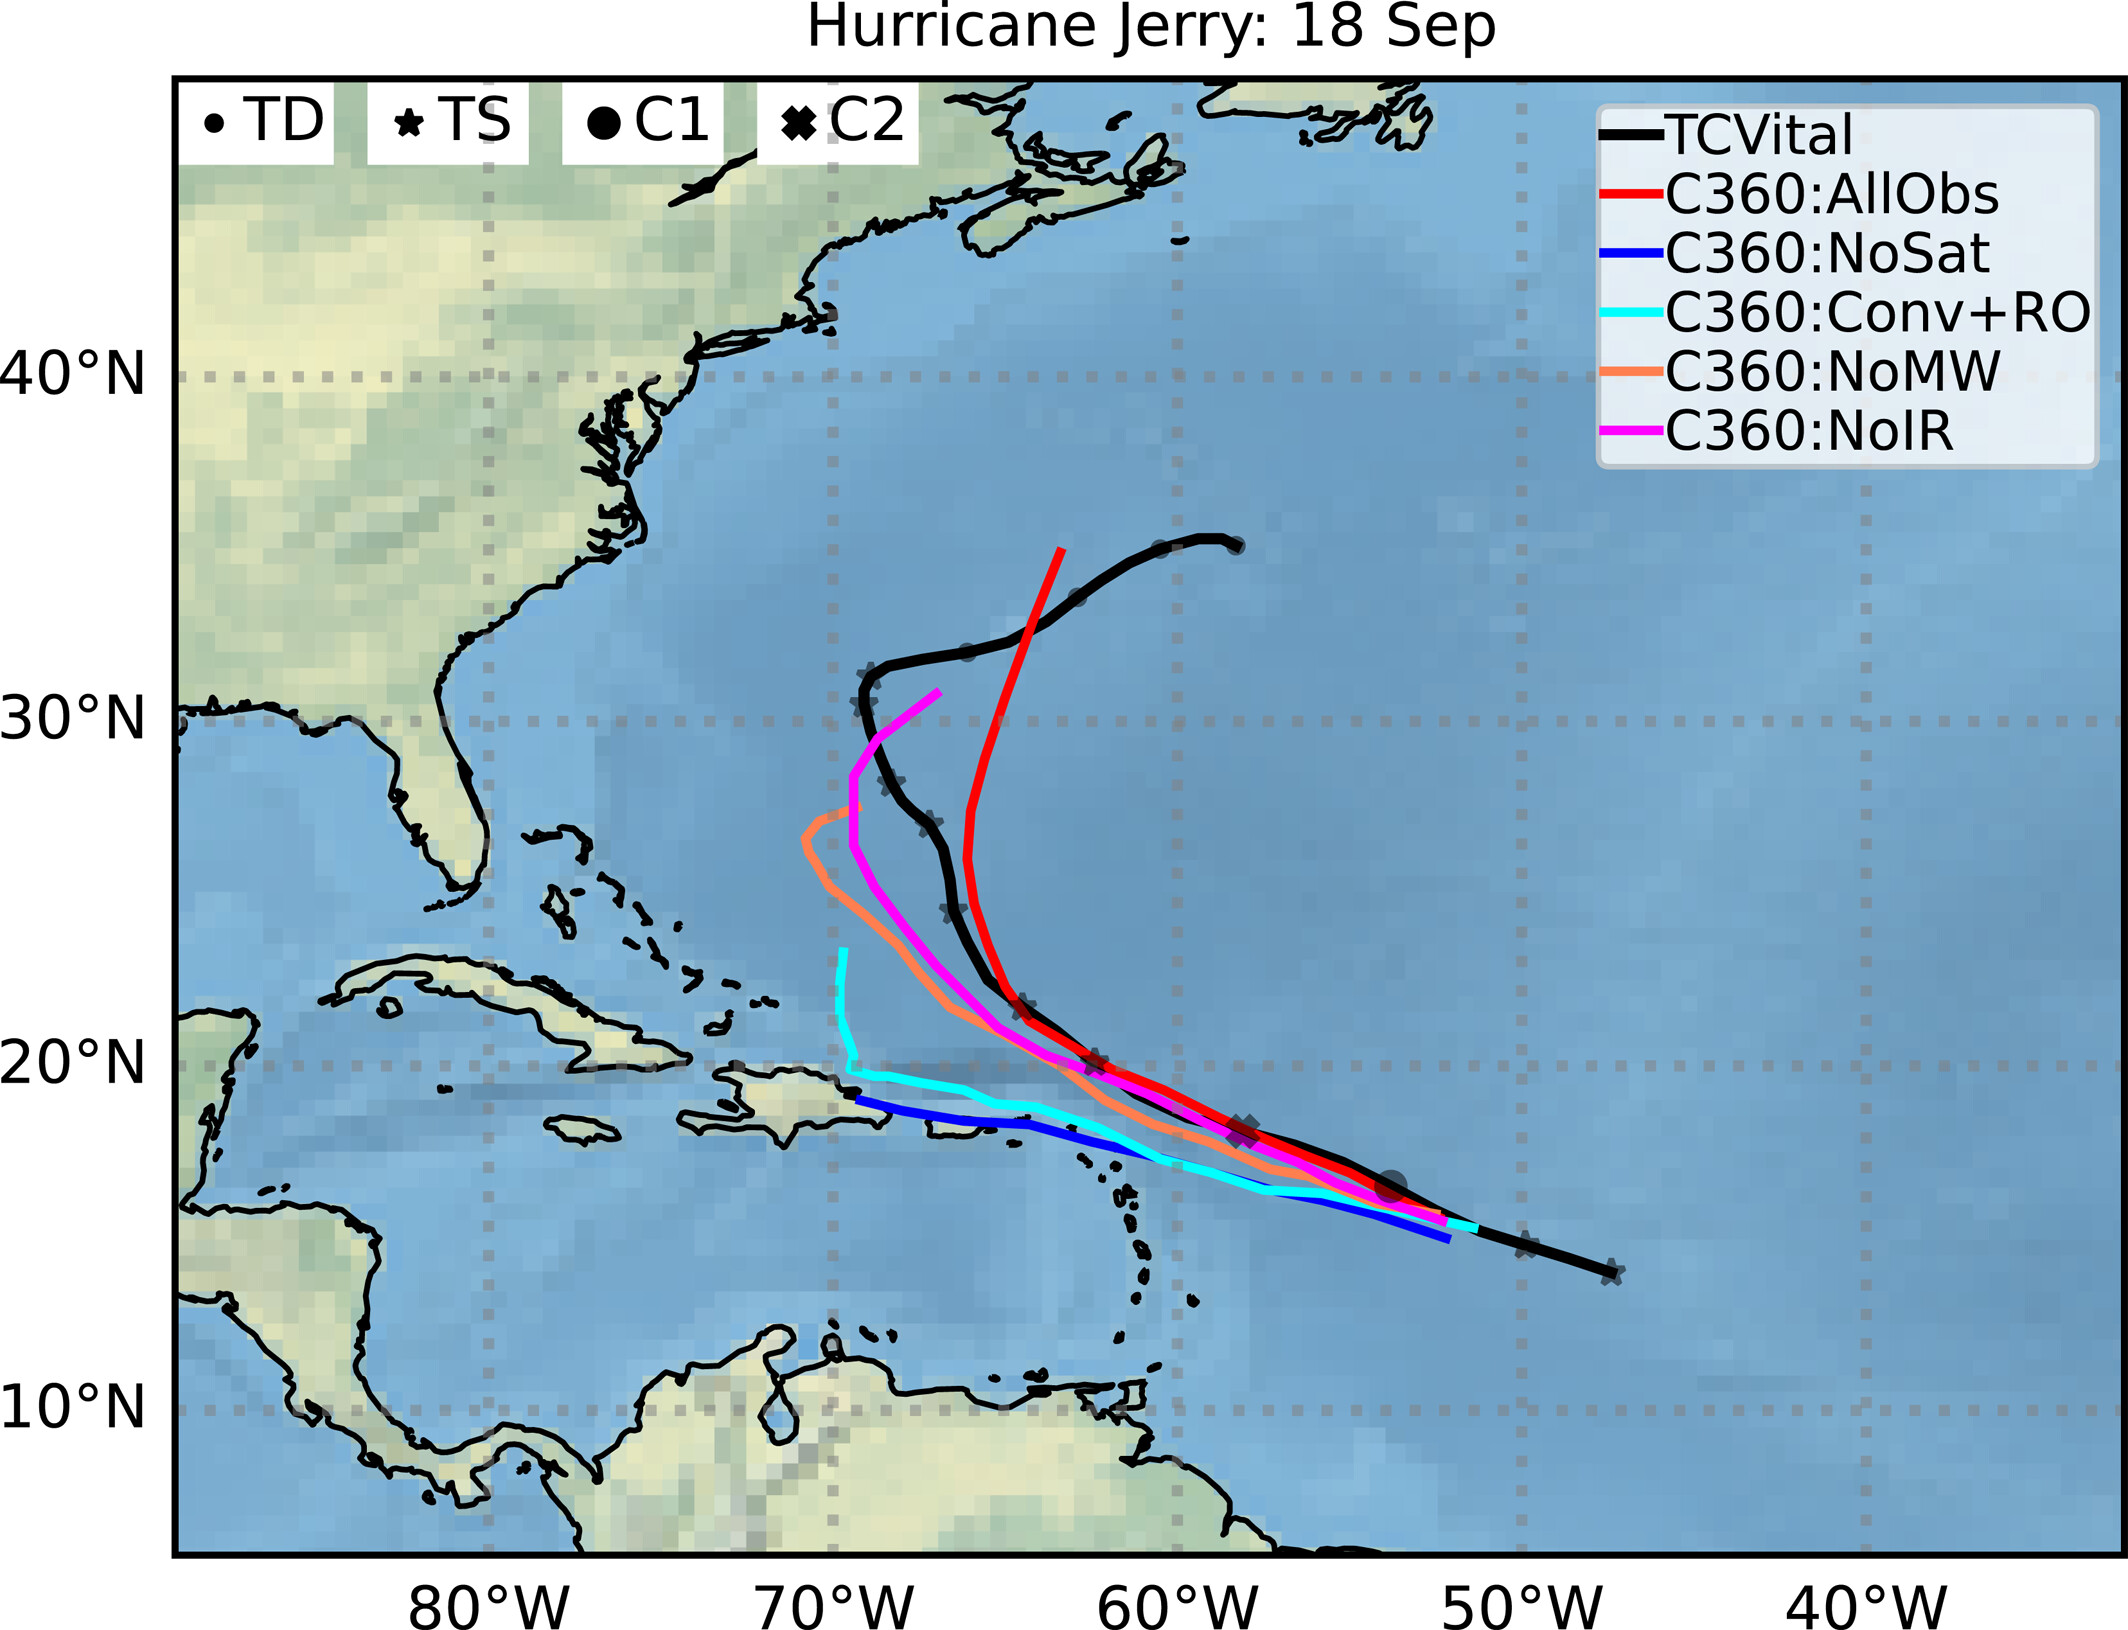
Impact of withholding different observations from the assimilation process on Hurricane Jerry’s track. Forecasts were initialized on 18 September 2019, and extend up to 5
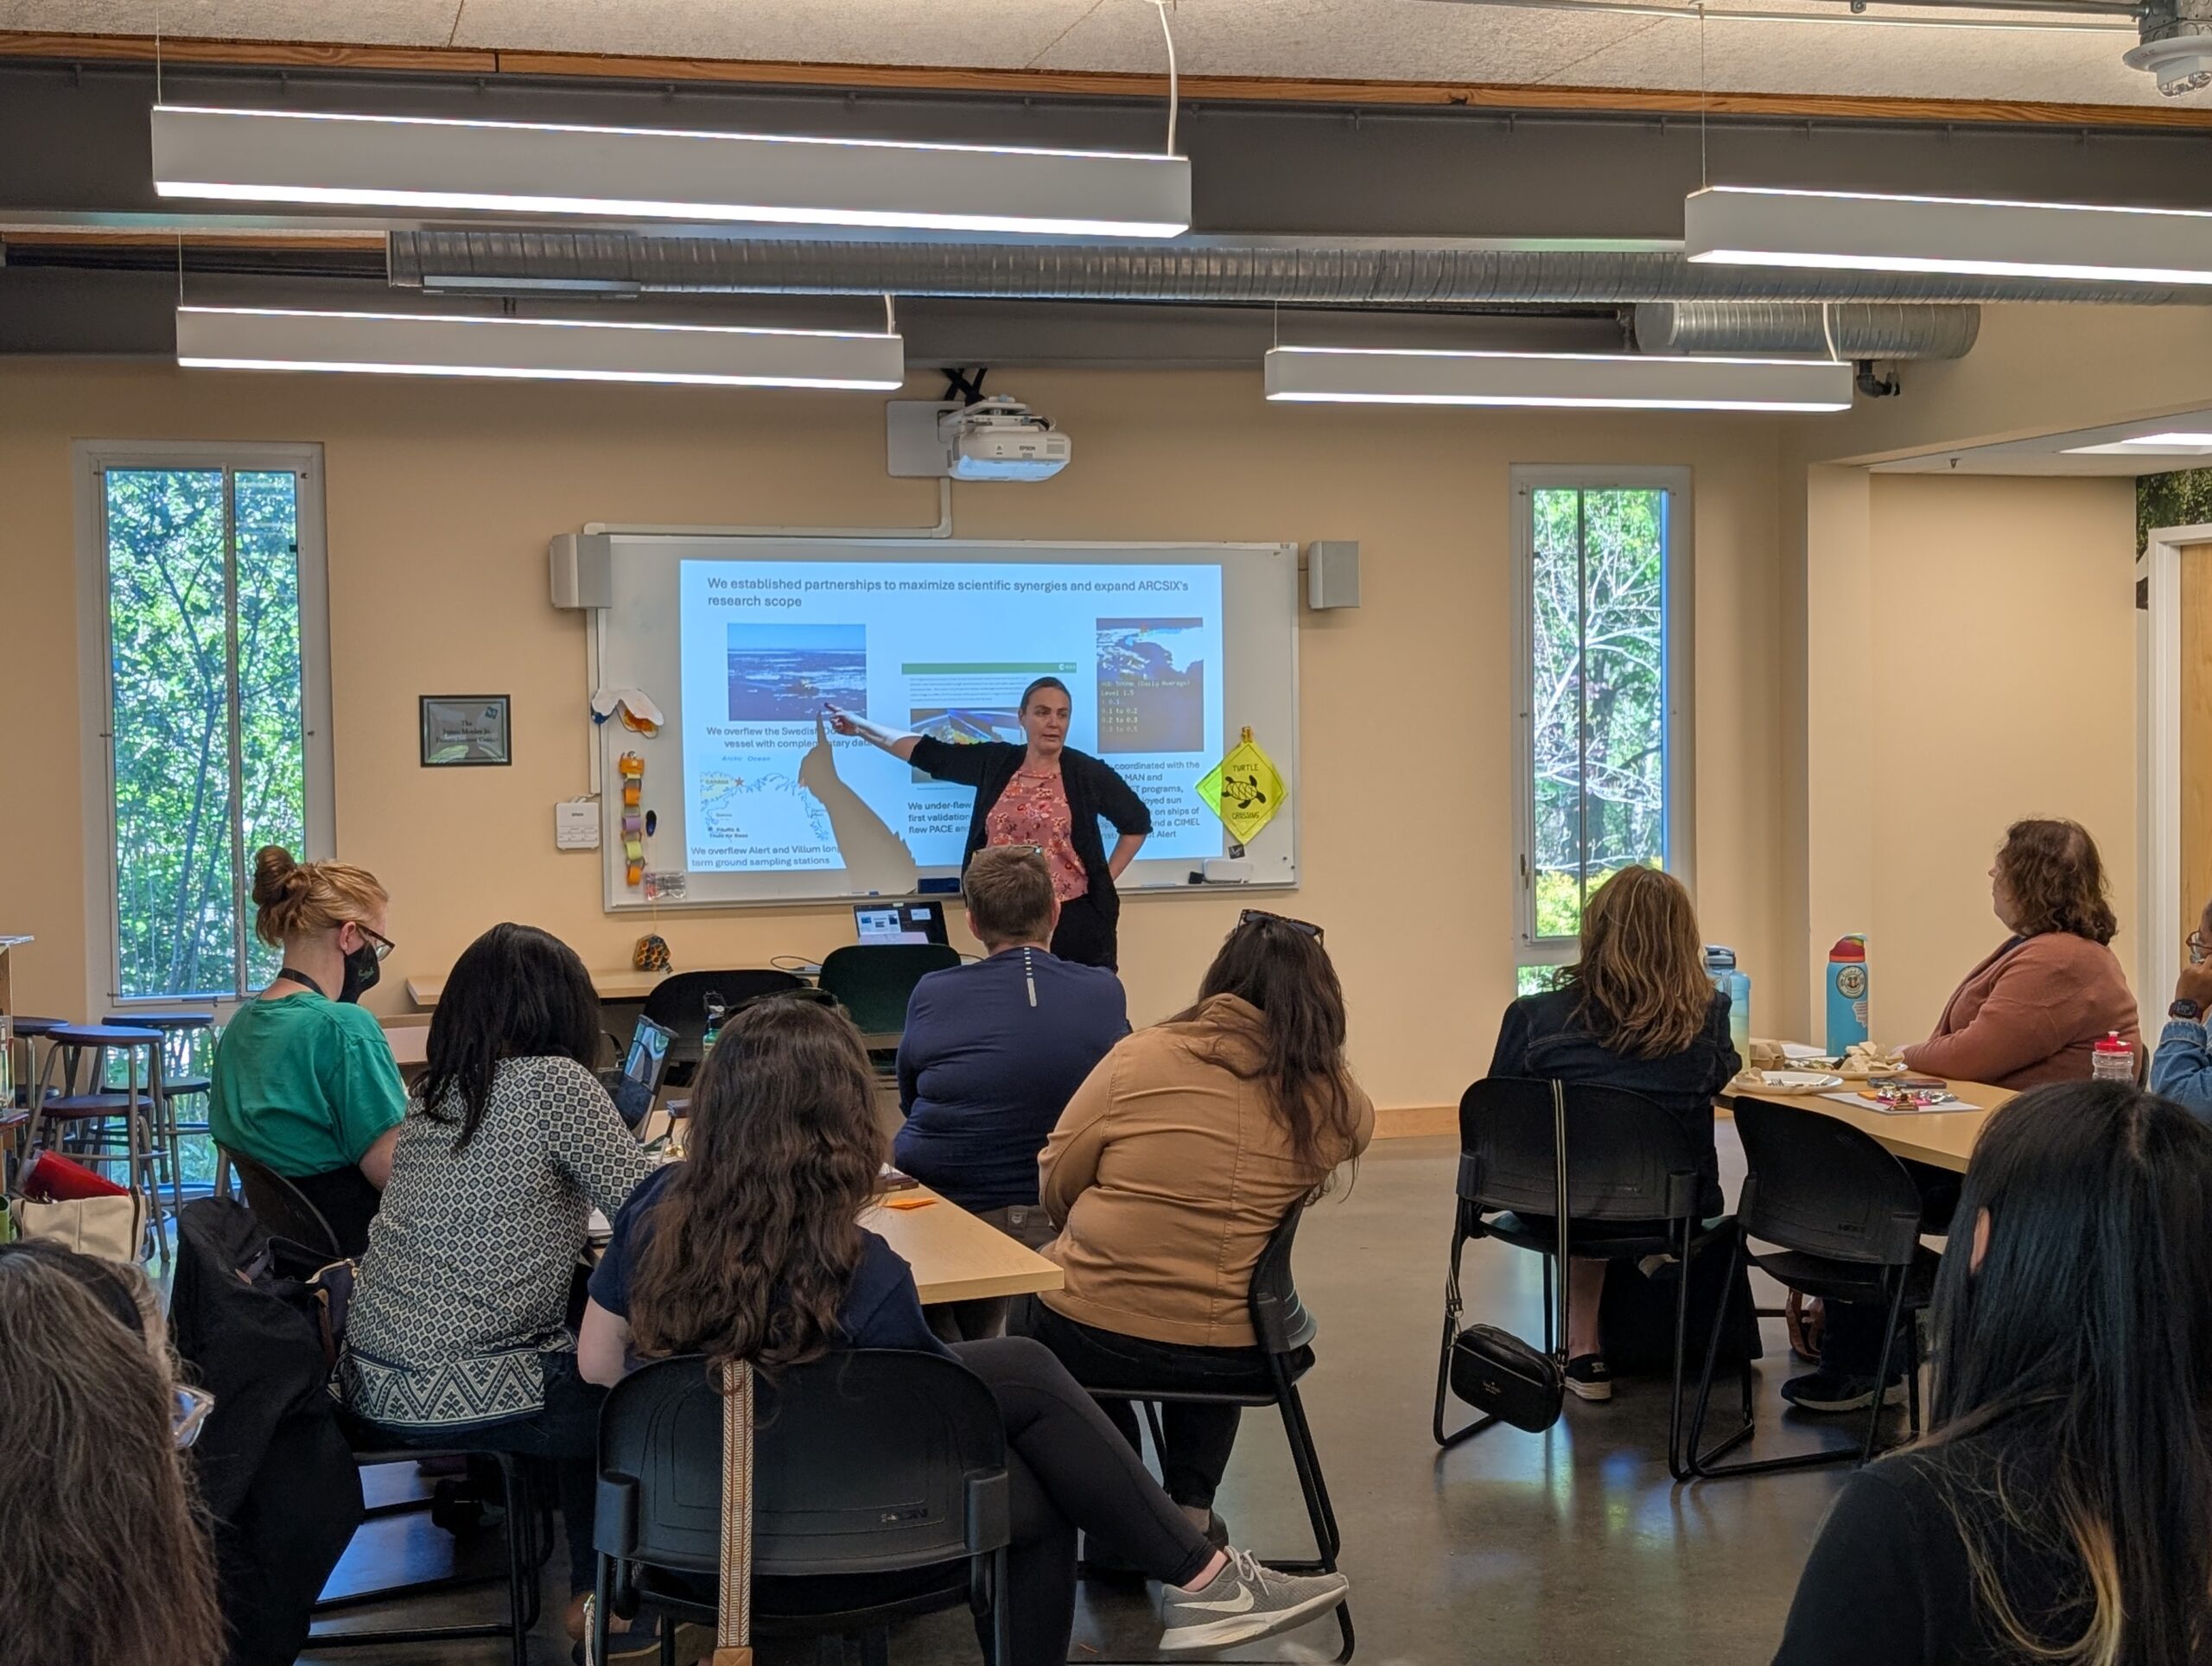
Lauren speaks to a group of teachers. Photo: Cazzy Medley On May 7th, ESSIC scientist Lauren Zamora visited Howard County Conservancy’s Youth Climate Institute to
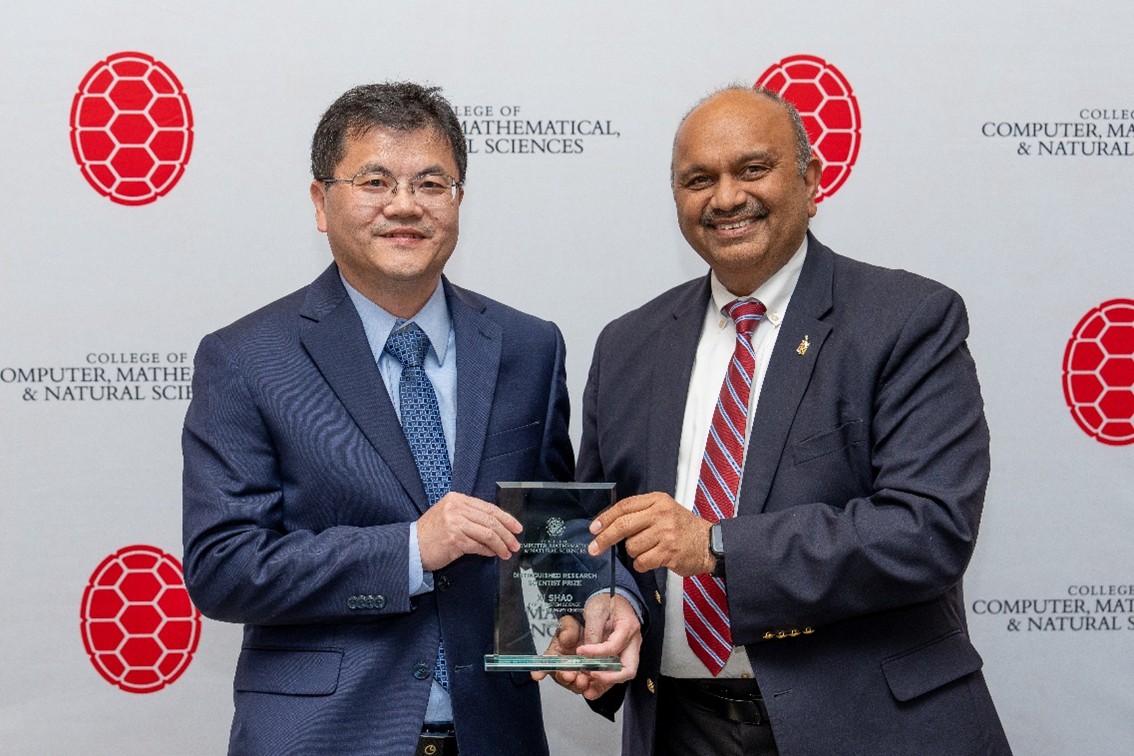
Xi Shao (on the left) receiving his award from CMNS Dean Amitabh Varshney. Photo credit: Mark Sherwood (UMD/CMNS) The University of Maryland College of Computer,
Alexey Mishonov is first author on the World Ocean Database 2023 (WOD23), the world’s most complete and representative digital collection to date of near real
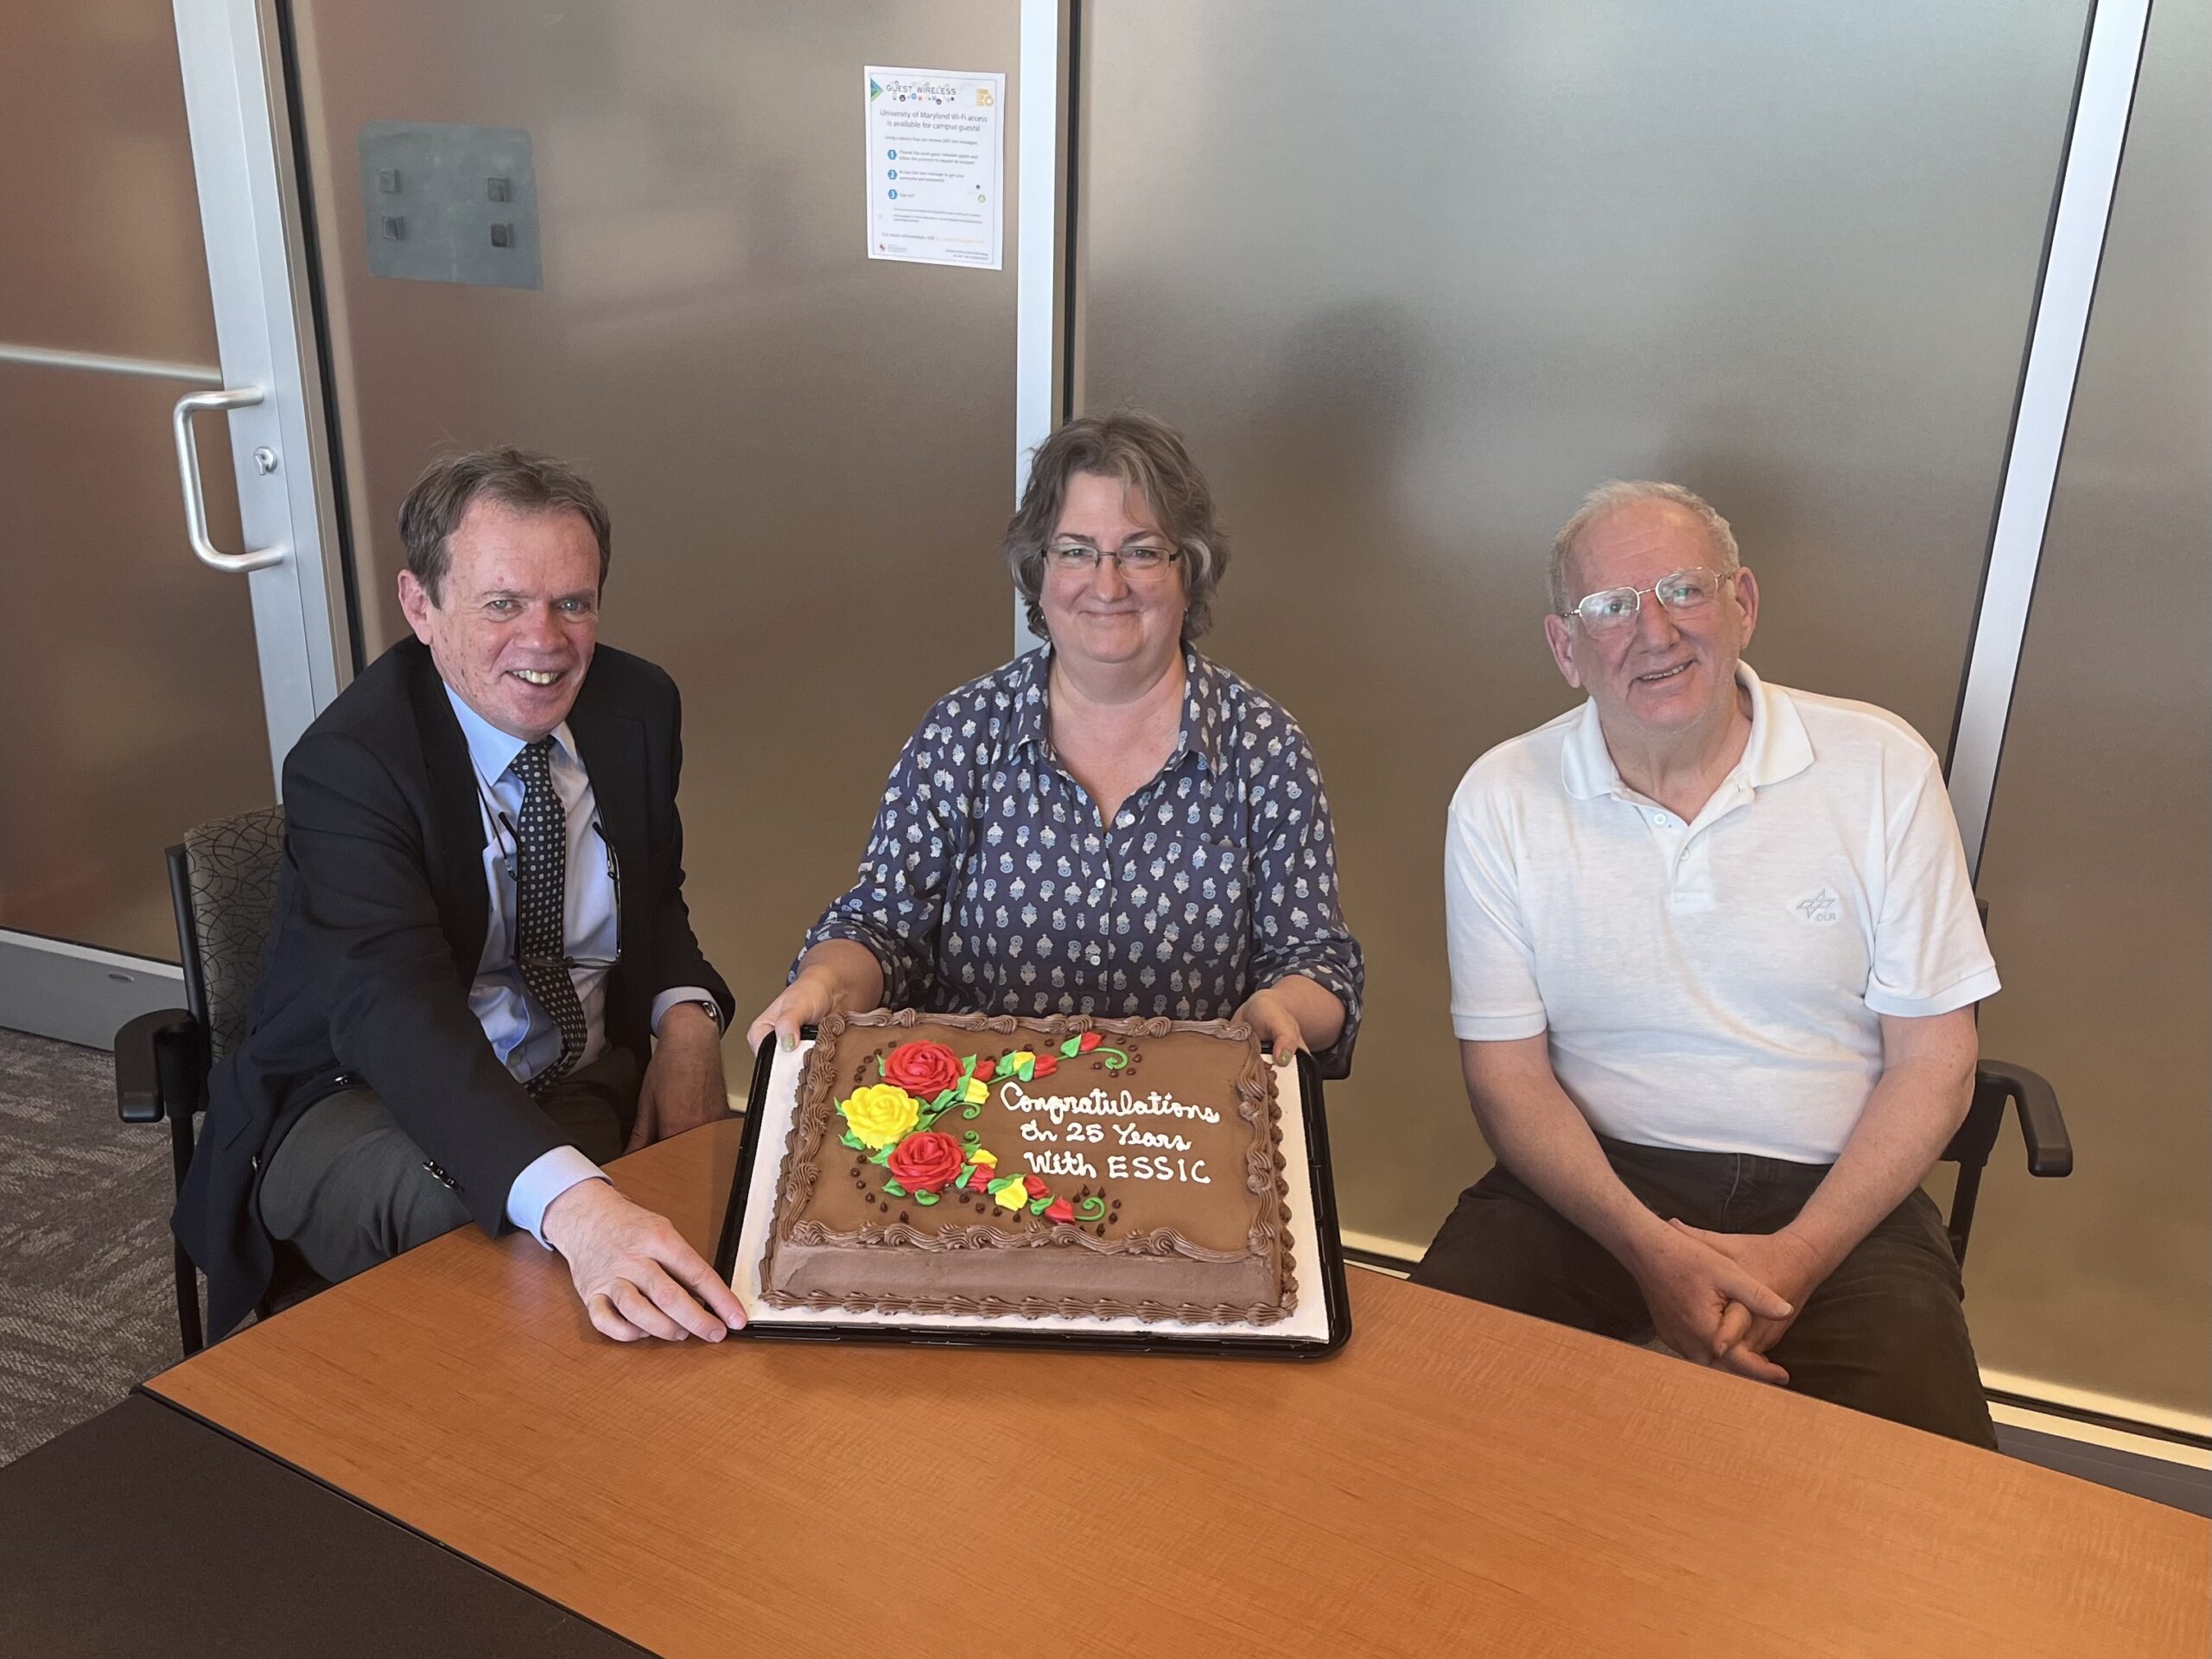
On April 1st, CISESS Coordinator Maureen Cribb got surprised, but it was not an April Fool’s Day prank! When Maureen arrived at the weekly CISESS

ESSIC Assistant Research Scientists Shashank Bhushan was recently featured in a NASA Early Career Spotlight, where he spoke about his career beginnings, research focus, and
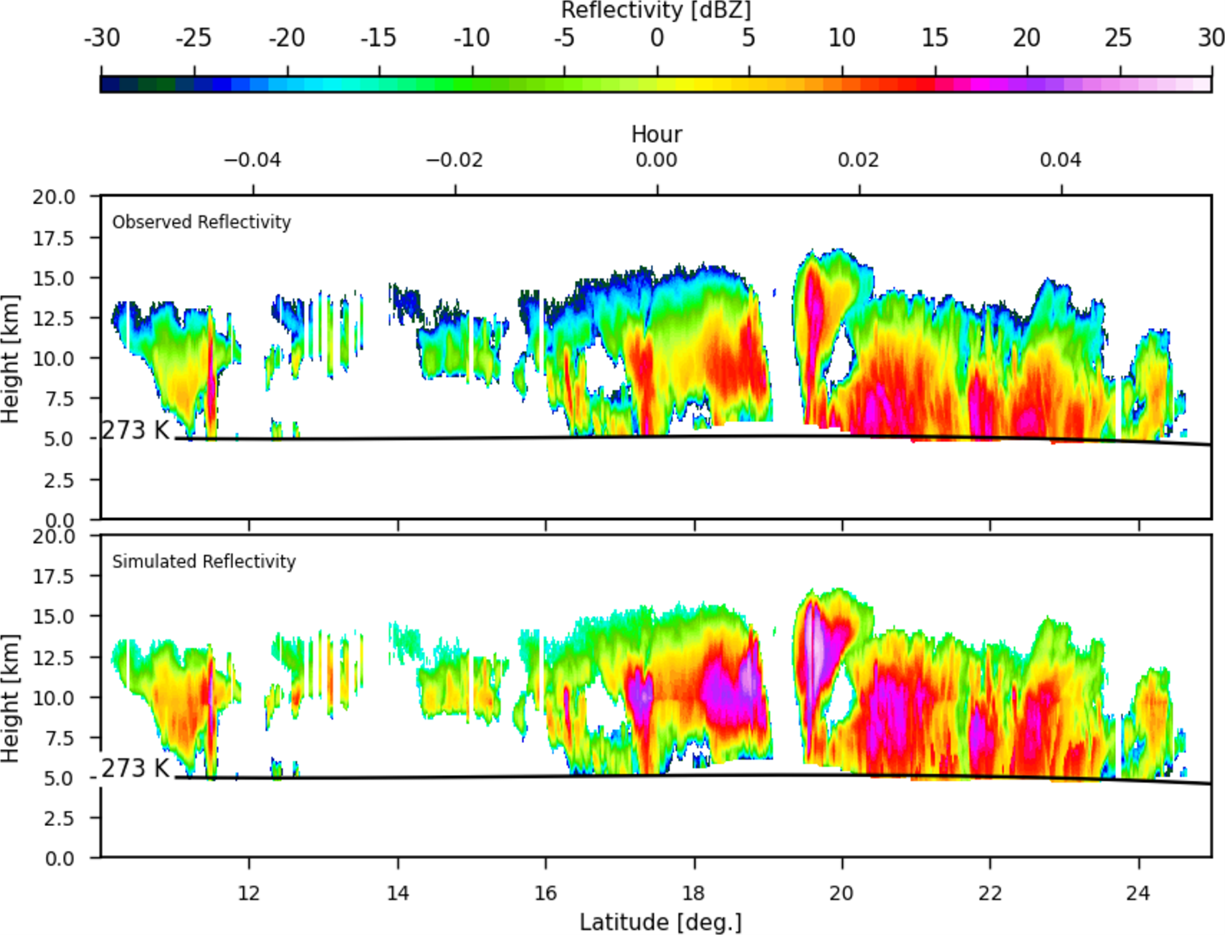
Figure: Observed (top panel) and simulated (bottom panel) CloudSat CPR reflectivities for Hurricane Bill on 19 August 2009 at 17:19 UTC. In their paper published

NOAA’s National Centers for Environmental Information (NCEI) has released their third version of the Greenland, Iceland, and Norwegian Seas (GINS) regional climatology product. ESSIC scientist
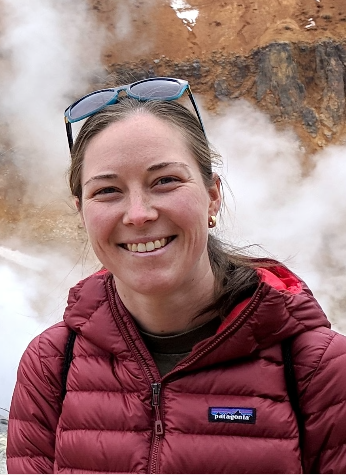
ESSIC Postdoctoral Associate Kathryn Moore was recently featured in a NASA Early Career Spotlight, where she spoke about her career beginnings, research focus, and impactful
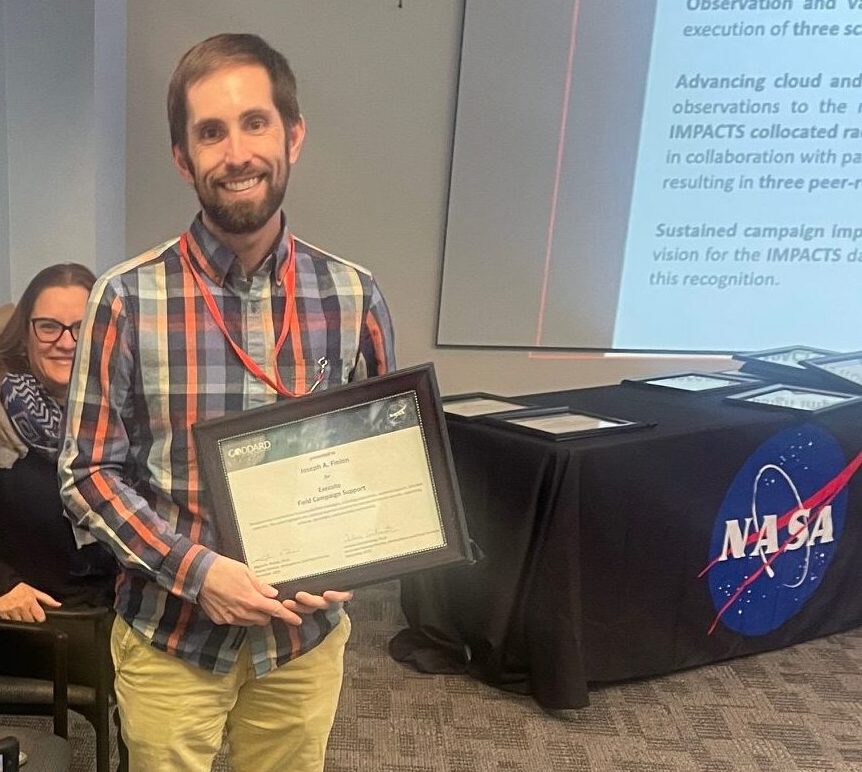
ESSIC Visiting Assistant Research Scientist Joseph Finlon is the newest recipient of the Field Campaign Support Award, one of the 2026 NASA Goddard Space Flight

CISESS Scientist Liqing Jiang, a chemical oceanographer specializing in the study of inorganic carbon cycling and ocean acidification in the global oceans, is one of