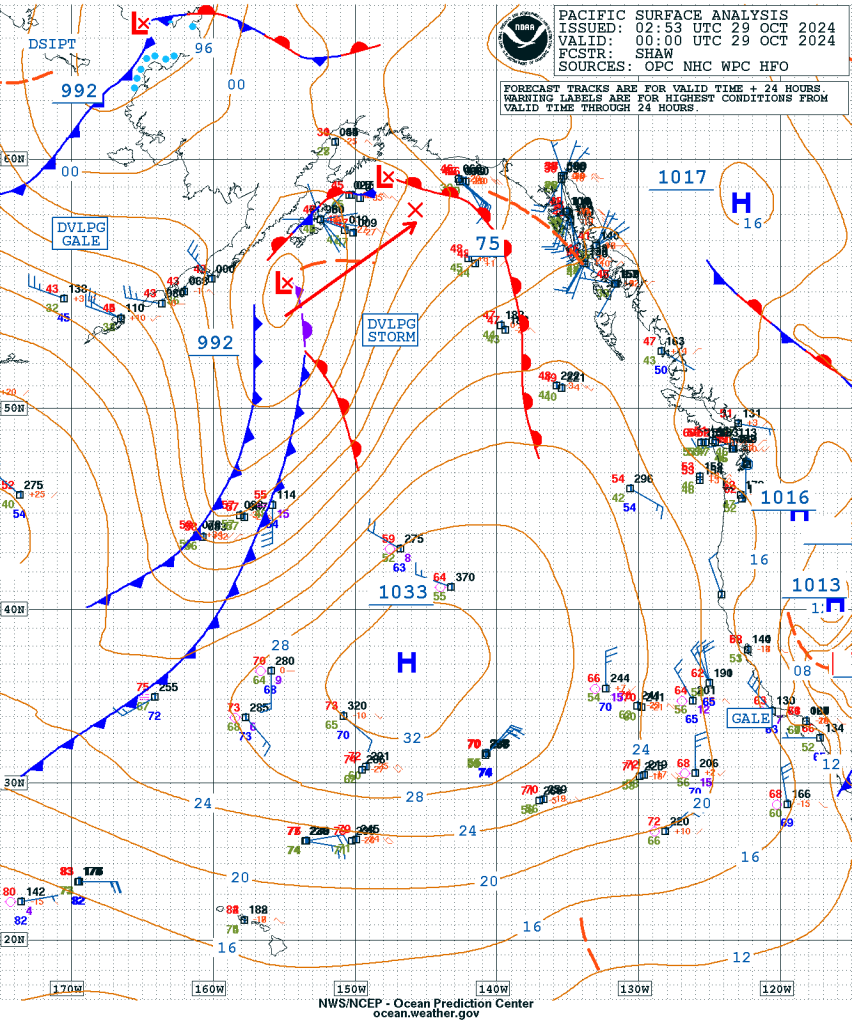
The North Pacific Basin continues to be extremely active and dangerous to mariners as the calendar heads into November. The first half of the week featured two storm-force lows, one in the Gulf of Alaska, one in the Bering Sea, while a hurricane-force low pushed toward the Aleutians for the latter half. On 28 October 2024, Anchorage, AK, received its first inch of snowfall of the season, as the first system pushed northeast near Kodiak Island as a 992 mb gale-force low.
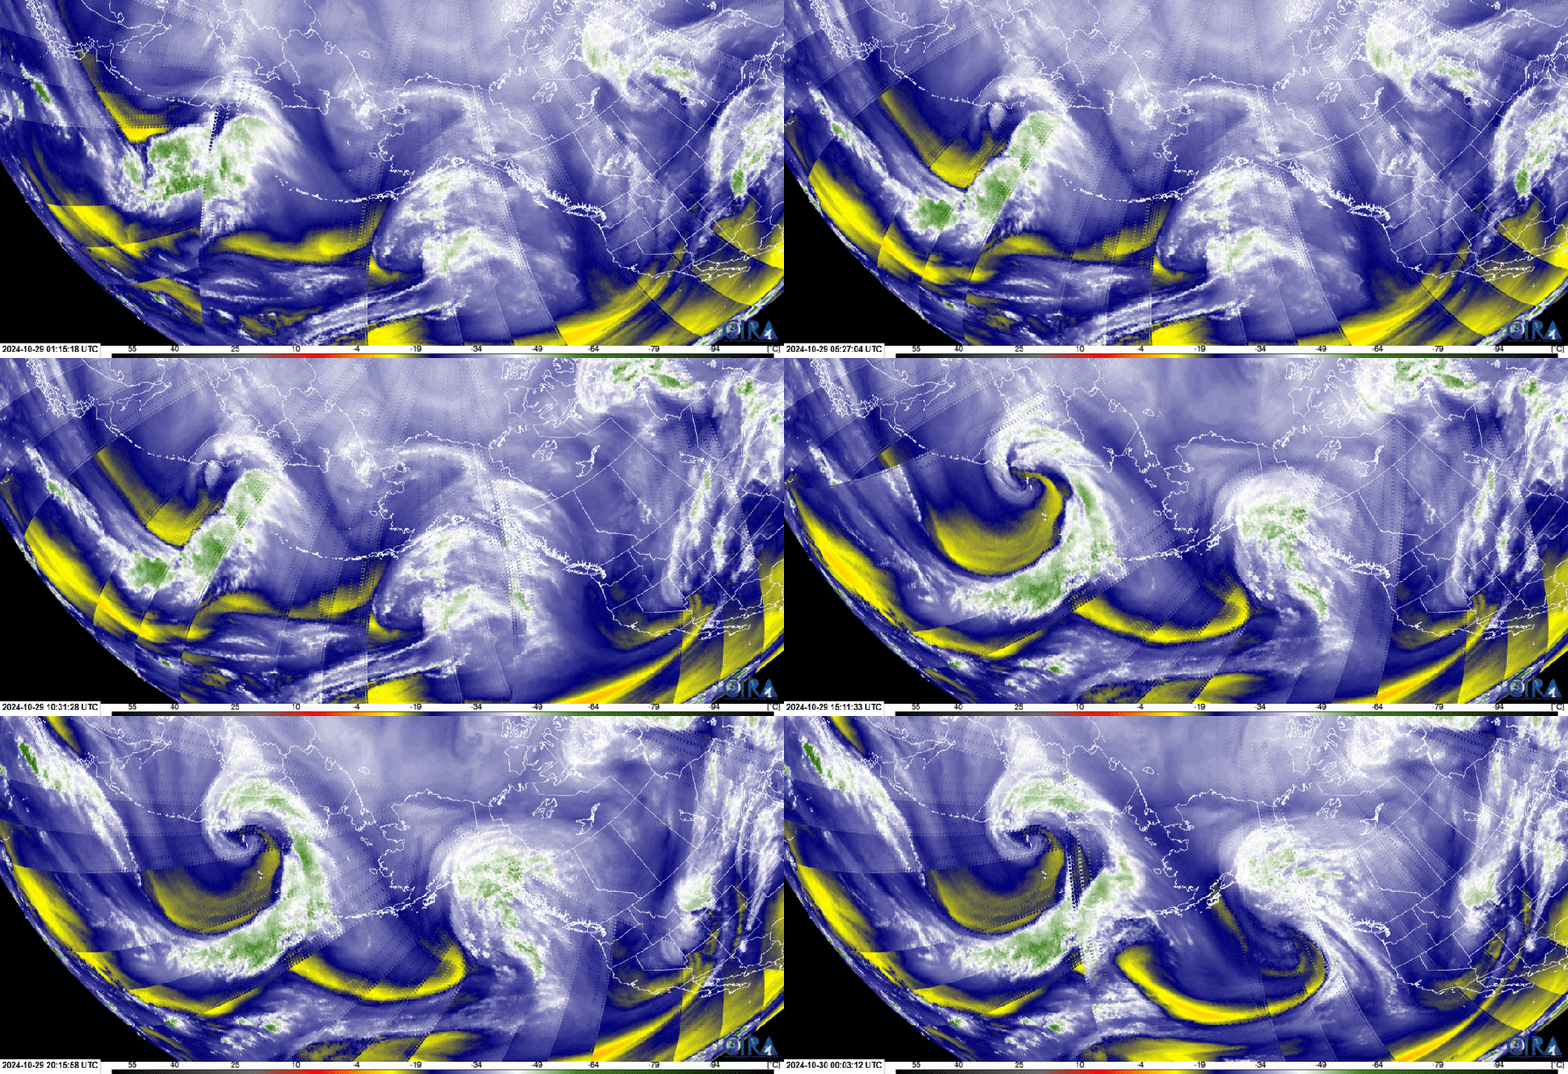
CrIS 6.9 um (ABI Mid-Level Water Vapor Band) imagery from ~0000 UTC 29 October 2024 to ~0000 UTC 30 October 2024, showed the evolution of the two extratropical cyclones, both of which were strengthening, with well-defined frontal features and dry, descending air pushing toward the respective circulations. CrIS imagery helps fill the void of geostationary imagery, specifically at the high latitudes where parallax also becomes a large issue, by averaging many bands of the hyperspectral sounder that provide temperature and moisture information.
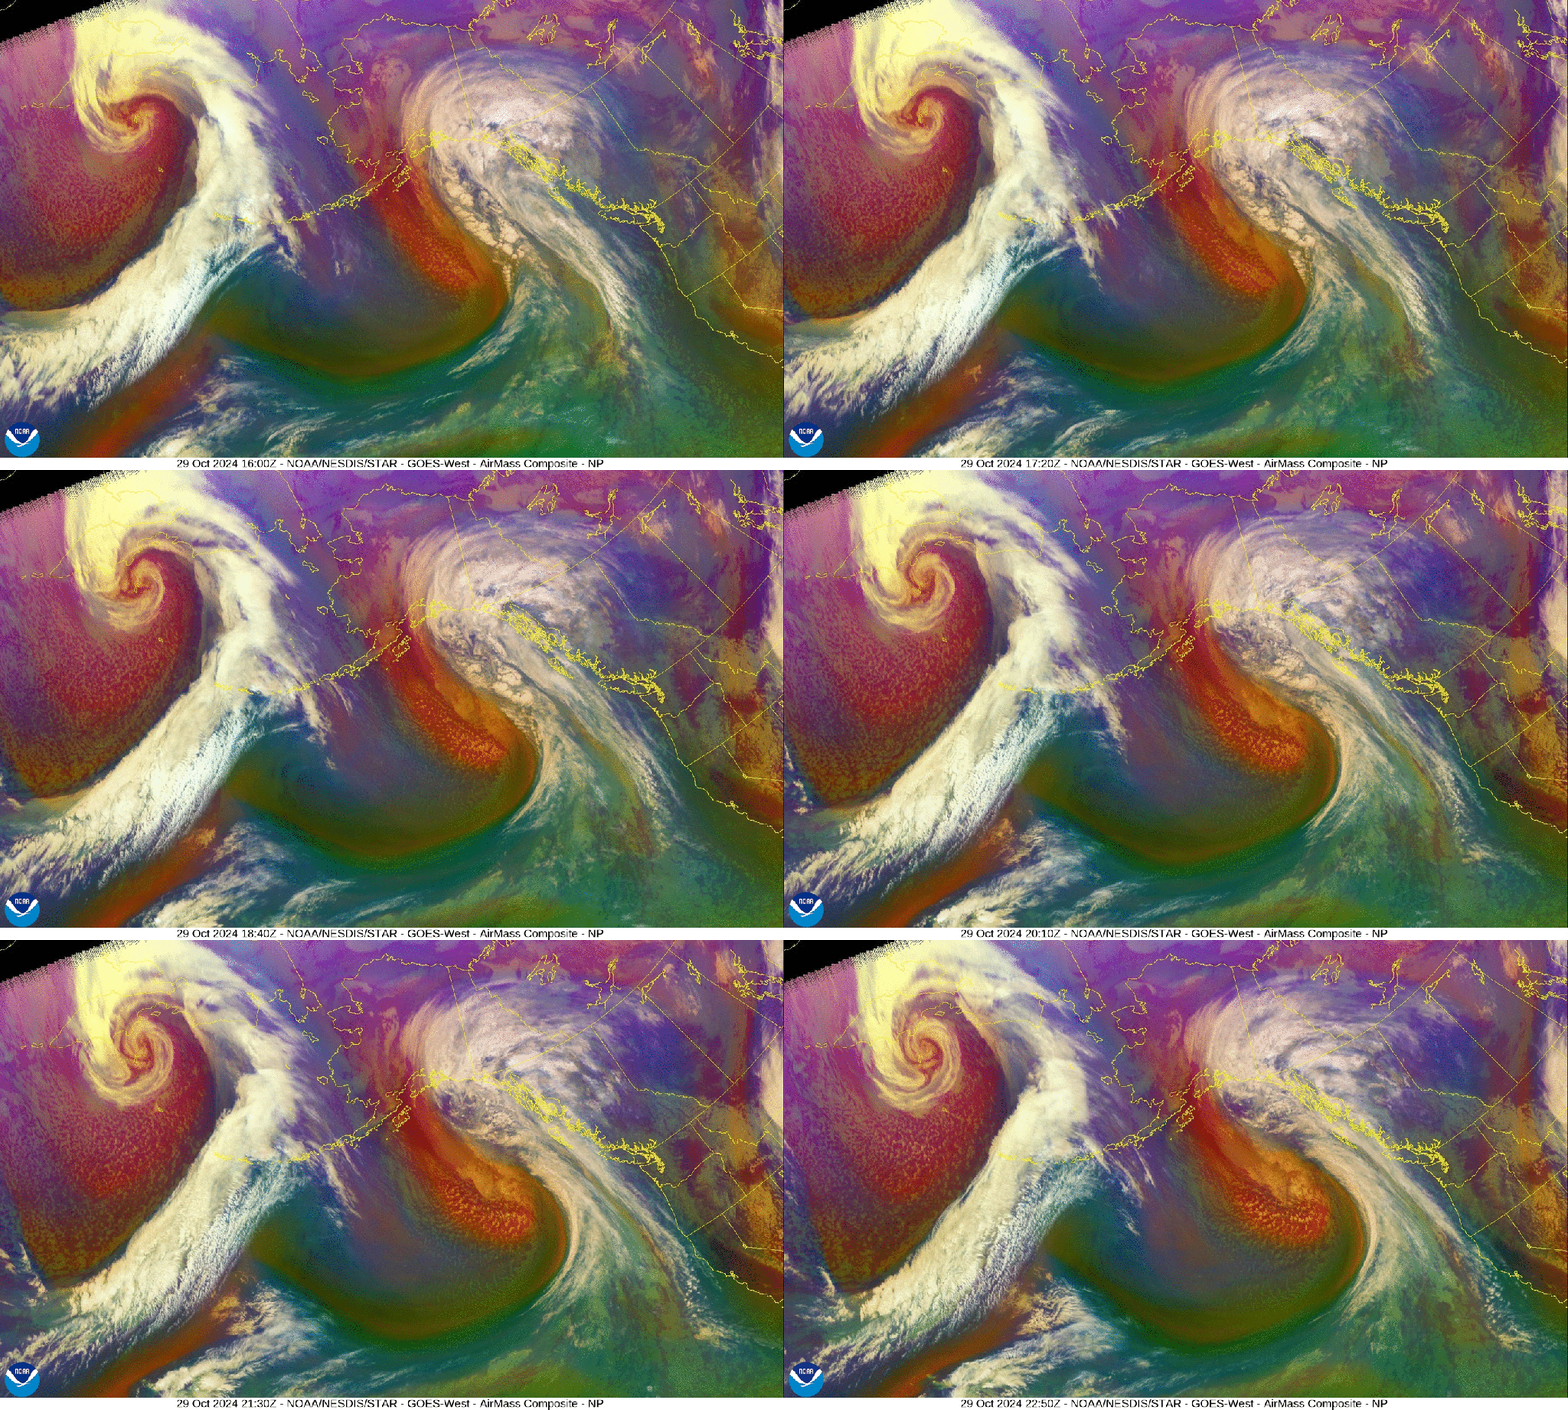
GOES-West Full Disk AirMass RGB imagery valid 1600 UTC to 2250 UTC 29 October 2024 also captured the two extratropical cyclones, with stratosphreic intrusions of high Potential Vorticity air lining up well with the dry air seen in the CrIS Mid-Level Water Vapor imagery. It’s quite notable for the Gulf of Alaska low that the dark red and orange colors (high potential vorticity) never fully wrap around the circulation of the system, possibly explaining why the system never fully reached hurricane-force strength.
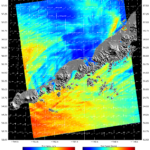
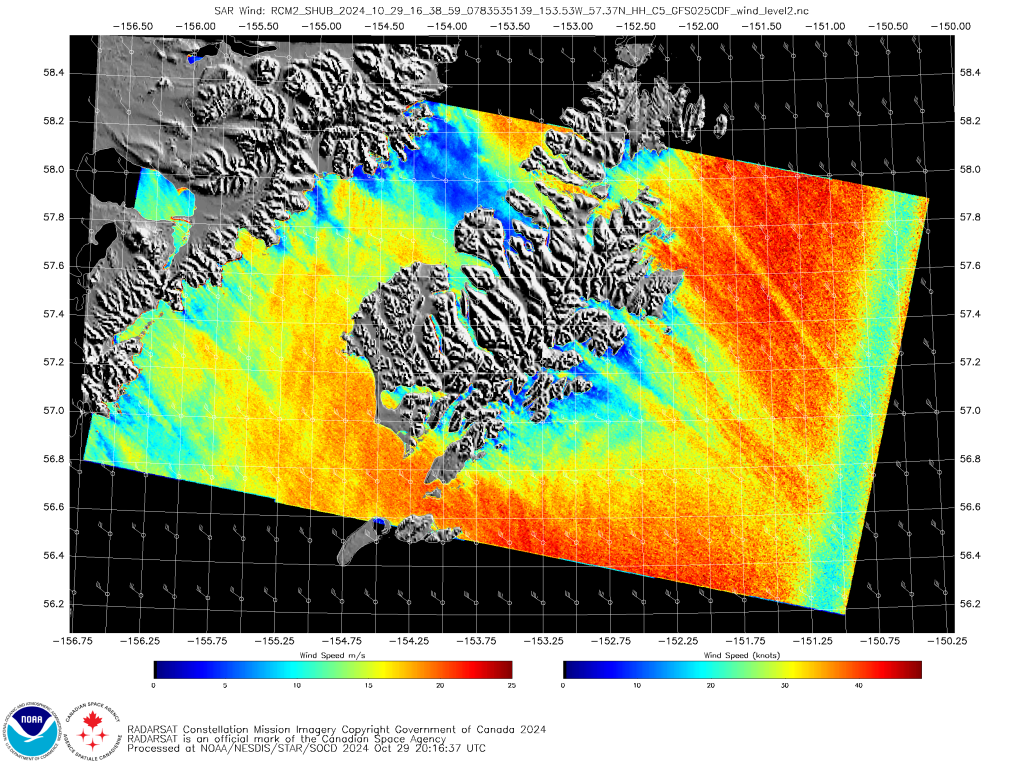
RadarSat Constellation Mission-2 (RCM-2) SAR RCM provided Synthetic Aperture Radar (SAR) Winds with a spatial resolution of 500-m at ~1649 UTC 29 October 2024 surrounding Kodiak Island, AK. Wind speeds exceeded 40 kts., and the effects of the terrain are evident.
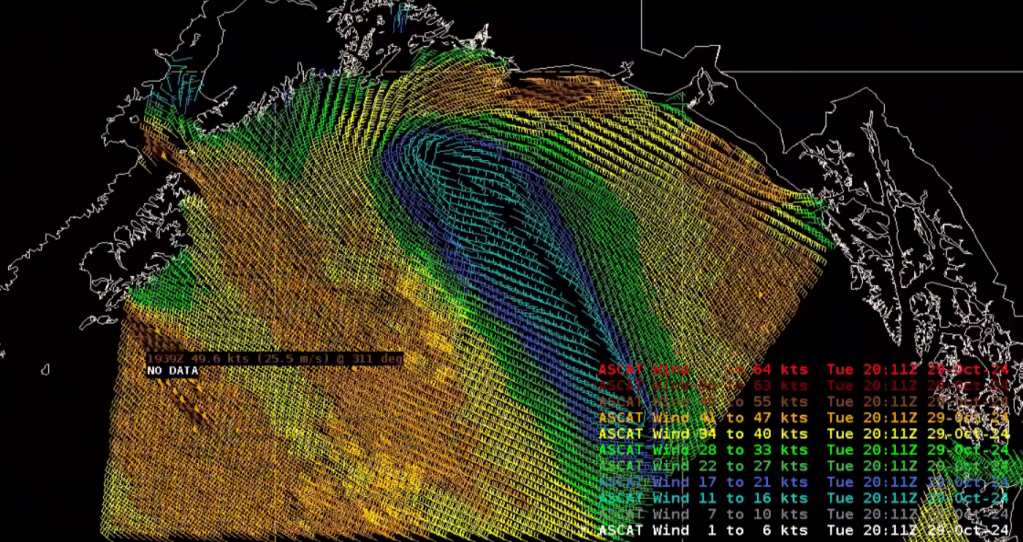
A Metop-C/ASCAT pass around ~2000 UTC 29 October 2024 confirmed the system reached storm-force, with winds in excess of 50 kts. north of the circulation center and near the southern end of Kodiak Island.
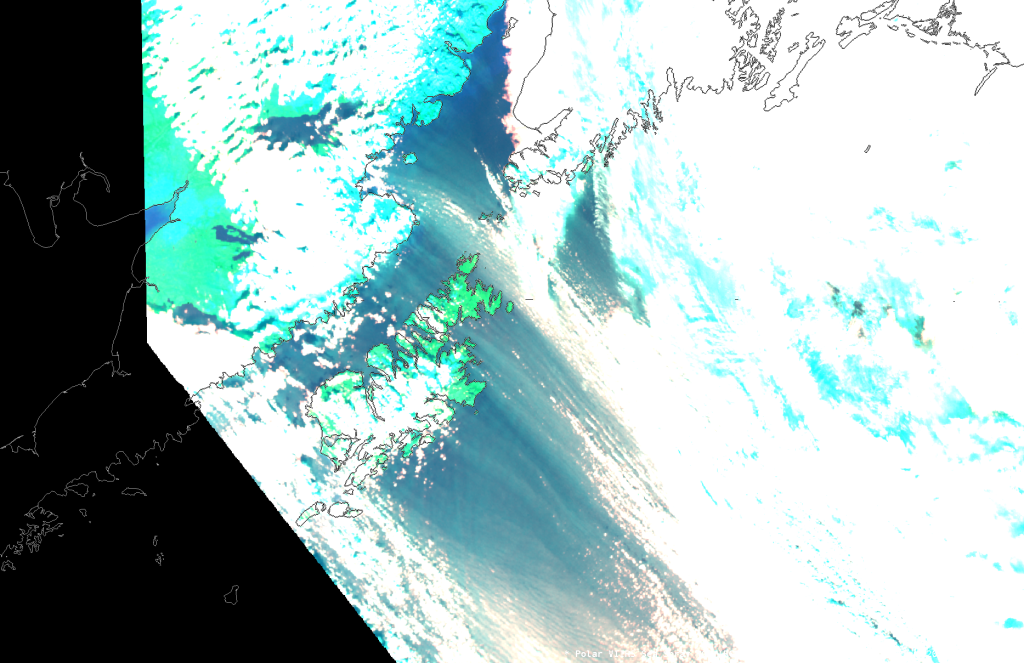
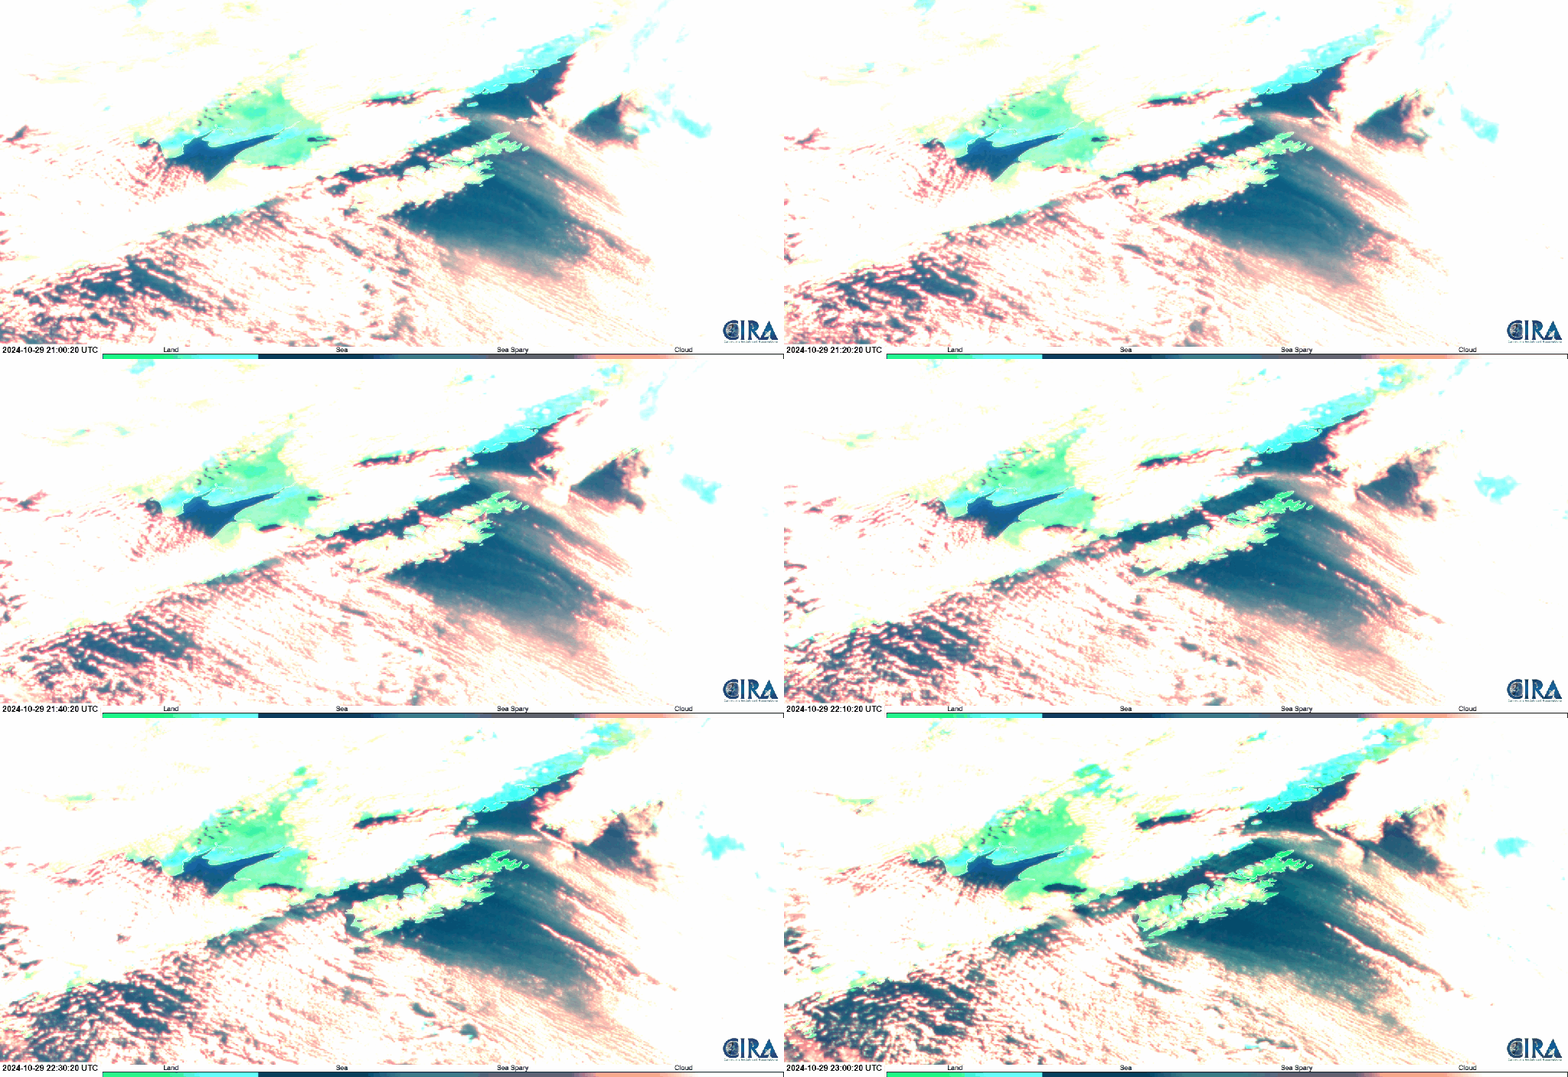
The strong northwest flow was able to cause sea spray, as was observed by the Sea Spray RGB. JPSS/VIIRS provides the Sea Spray RGB at a high resolution of 375-m, making it easy to pick out sea spray with its medium cyan-gray color, with cloud streets developing downstream. While the GOES Sea Spray RGB has a coarser spatial resolution, the timely 10-minute observations allow the user to see the movement of the sea spray in realtime.
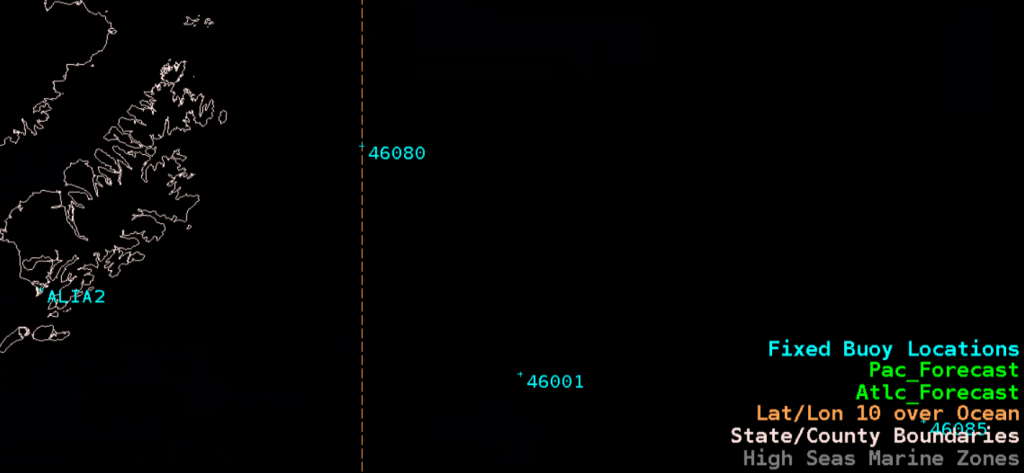
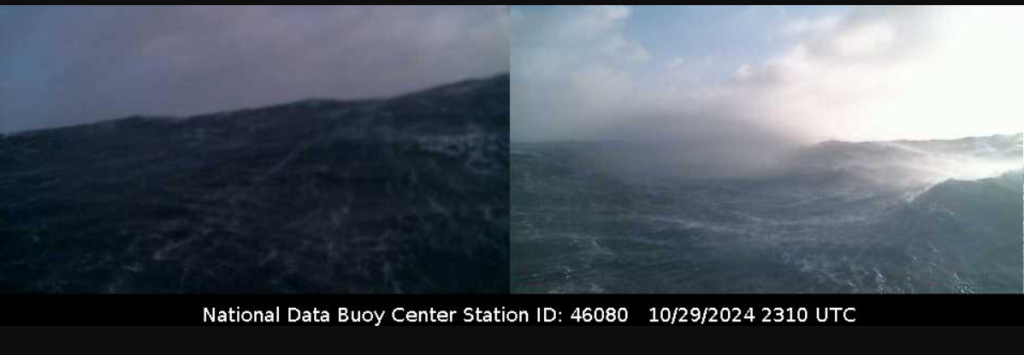
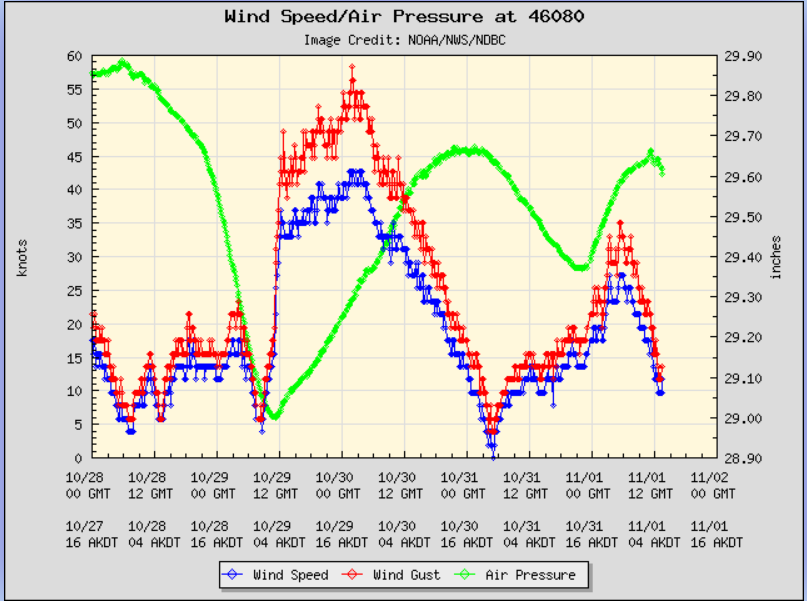
Buoy #46080, located east of Kodiak Island, had photographs taken at 2310 UTC 29 October 2024, capturing the massive waves. The pressure at the buoy bottomed out around 29.00″ of Hg, or 982 mb, shortly before 1200 UTC 29 October 2024, while winds peaked after 0300 UTC 30 October 2024, sustained over 40 kts., with gusts near 60 kts.
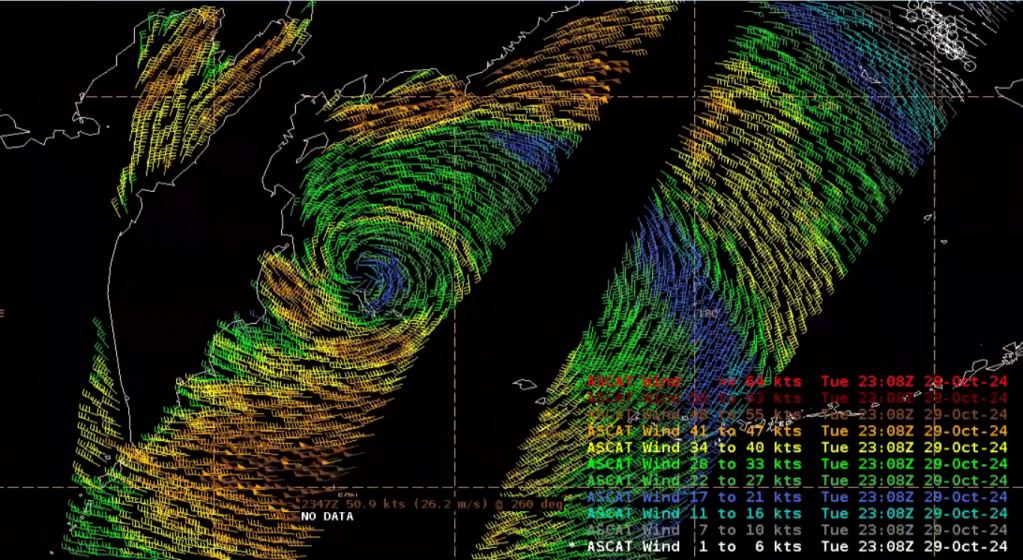
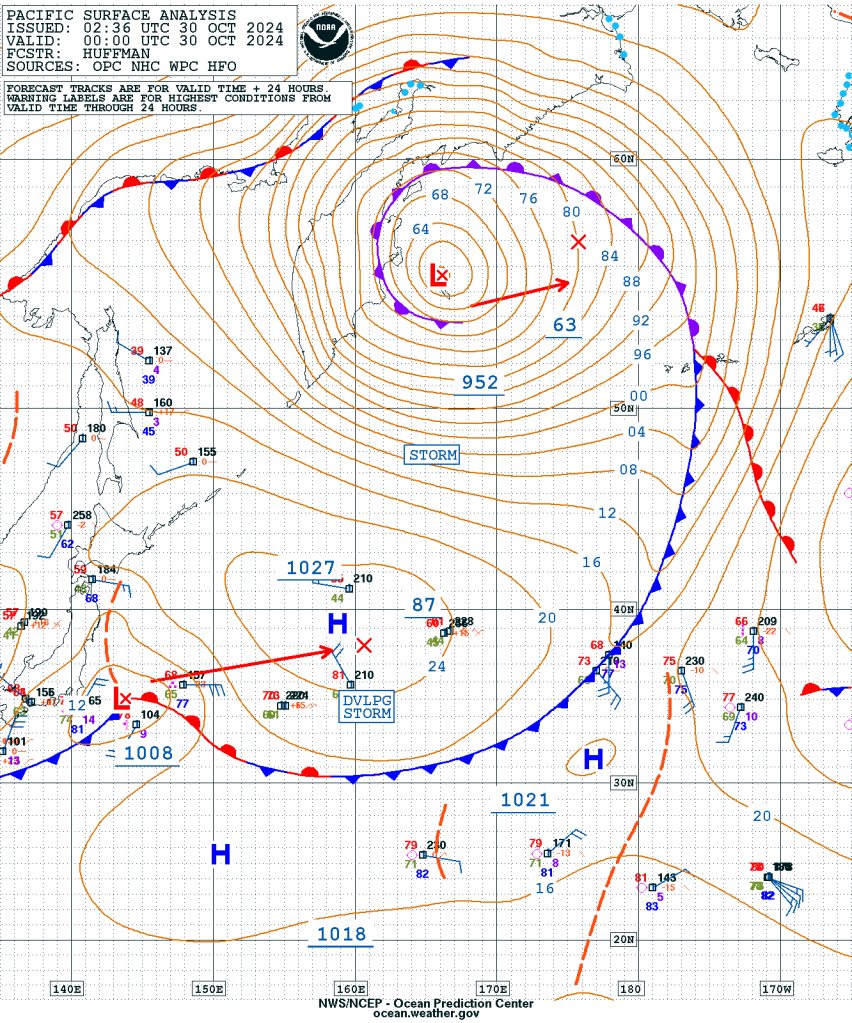
A Metop-B/ASCAT pass in the western Bering Sea at 2347 UTC 29 October 2024 observed the second storm-force low with wind speeds in excess of 50 kts. south of the circulation. OPC Surface Analysis valid 0000 UTC 30 October 2024 had the extratropical cyclone with a minimum central pressure of 952 mb.
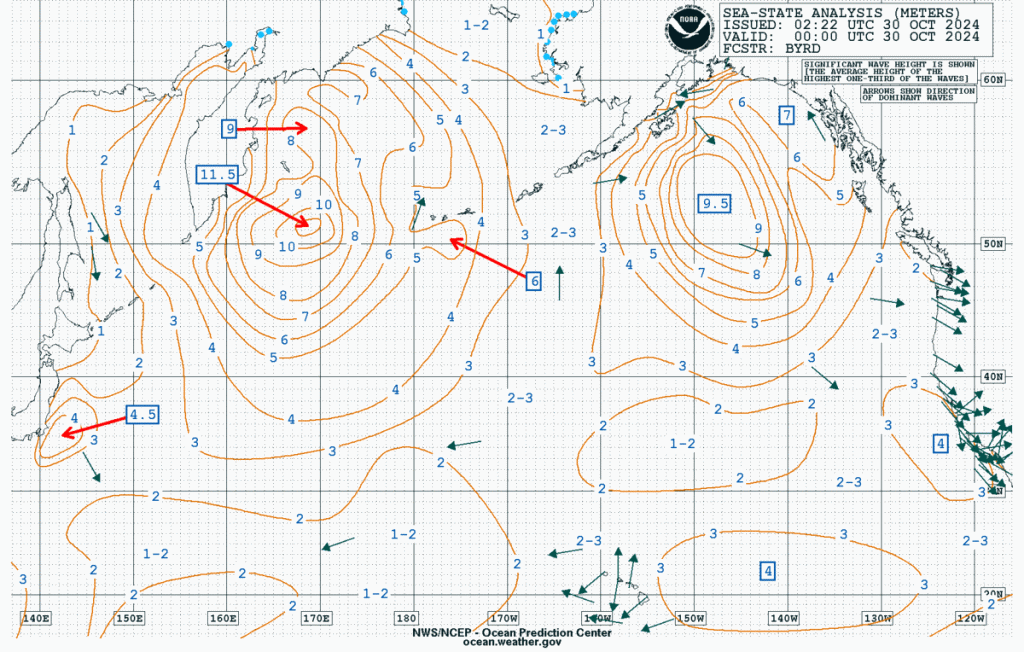
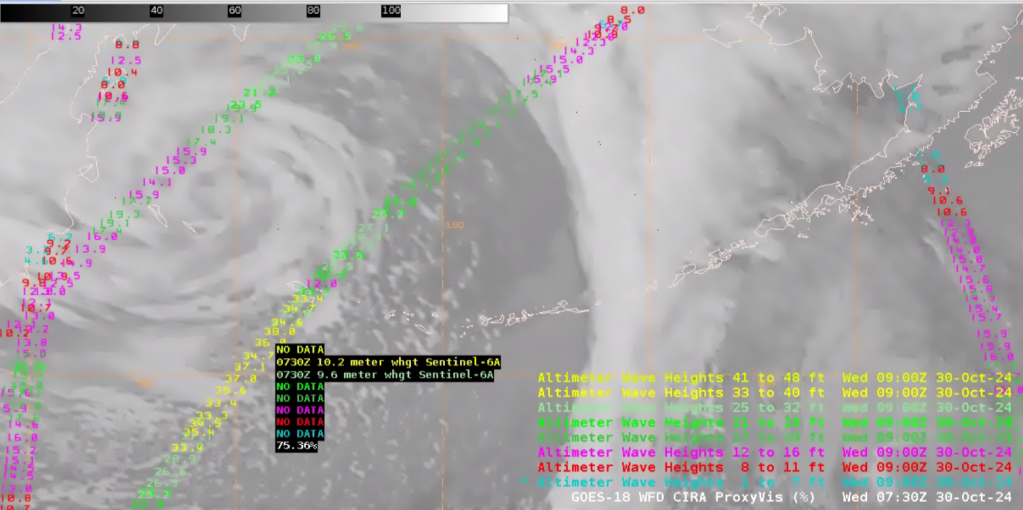
OPC North Pacific Sea-State Analysis showcased the massive significant wave heights across the North Pacific, reaching 11.5 meters in the western Bering Sea, and 9.5 meters in the southern Gulf of Alaska. A Sentinel-6a pass at ~0730 UTC 30 October 2024, confirmed significant wave heights in excess of 37 feet in the southeast quadrant of the Bering Sea low.
The strongest system of the week came on Halloween as a Hurricane-force low developed in the Central Northern Pacific at 1200 UTC 31 October 2024. GOES-West Full Disk Air Mass RGB imagery from ~0630 UTC to ~1230 UTC 01 November 2024, showed the hurricane-force low pushing towards the Aleutians with a banded cloud-head near the tail-end of the occluded front, and orange and red colors, signals for very intense extratropical cyclones.
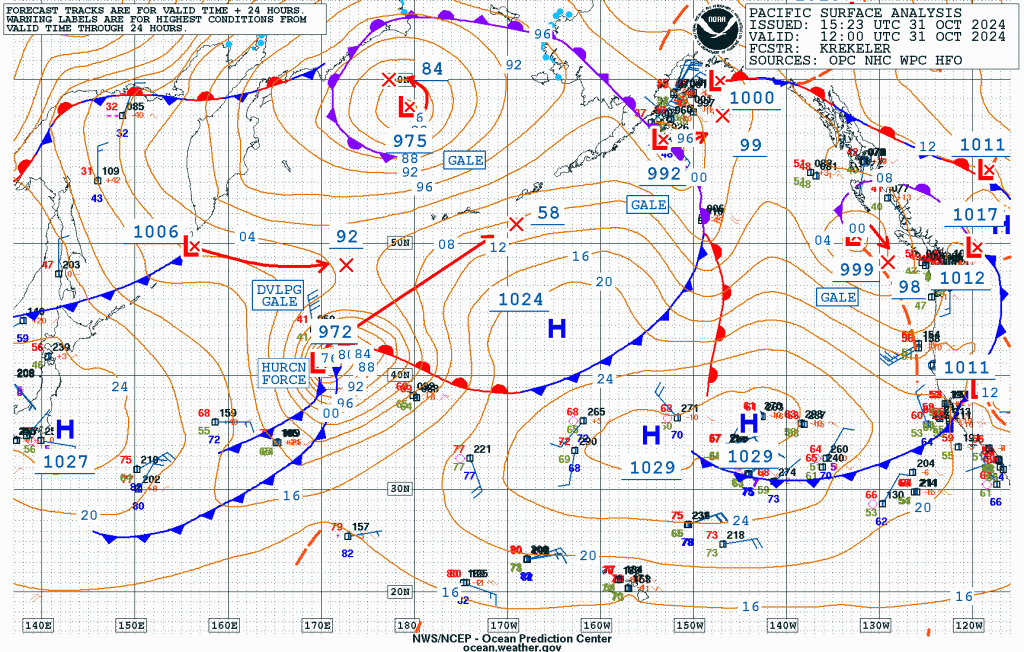
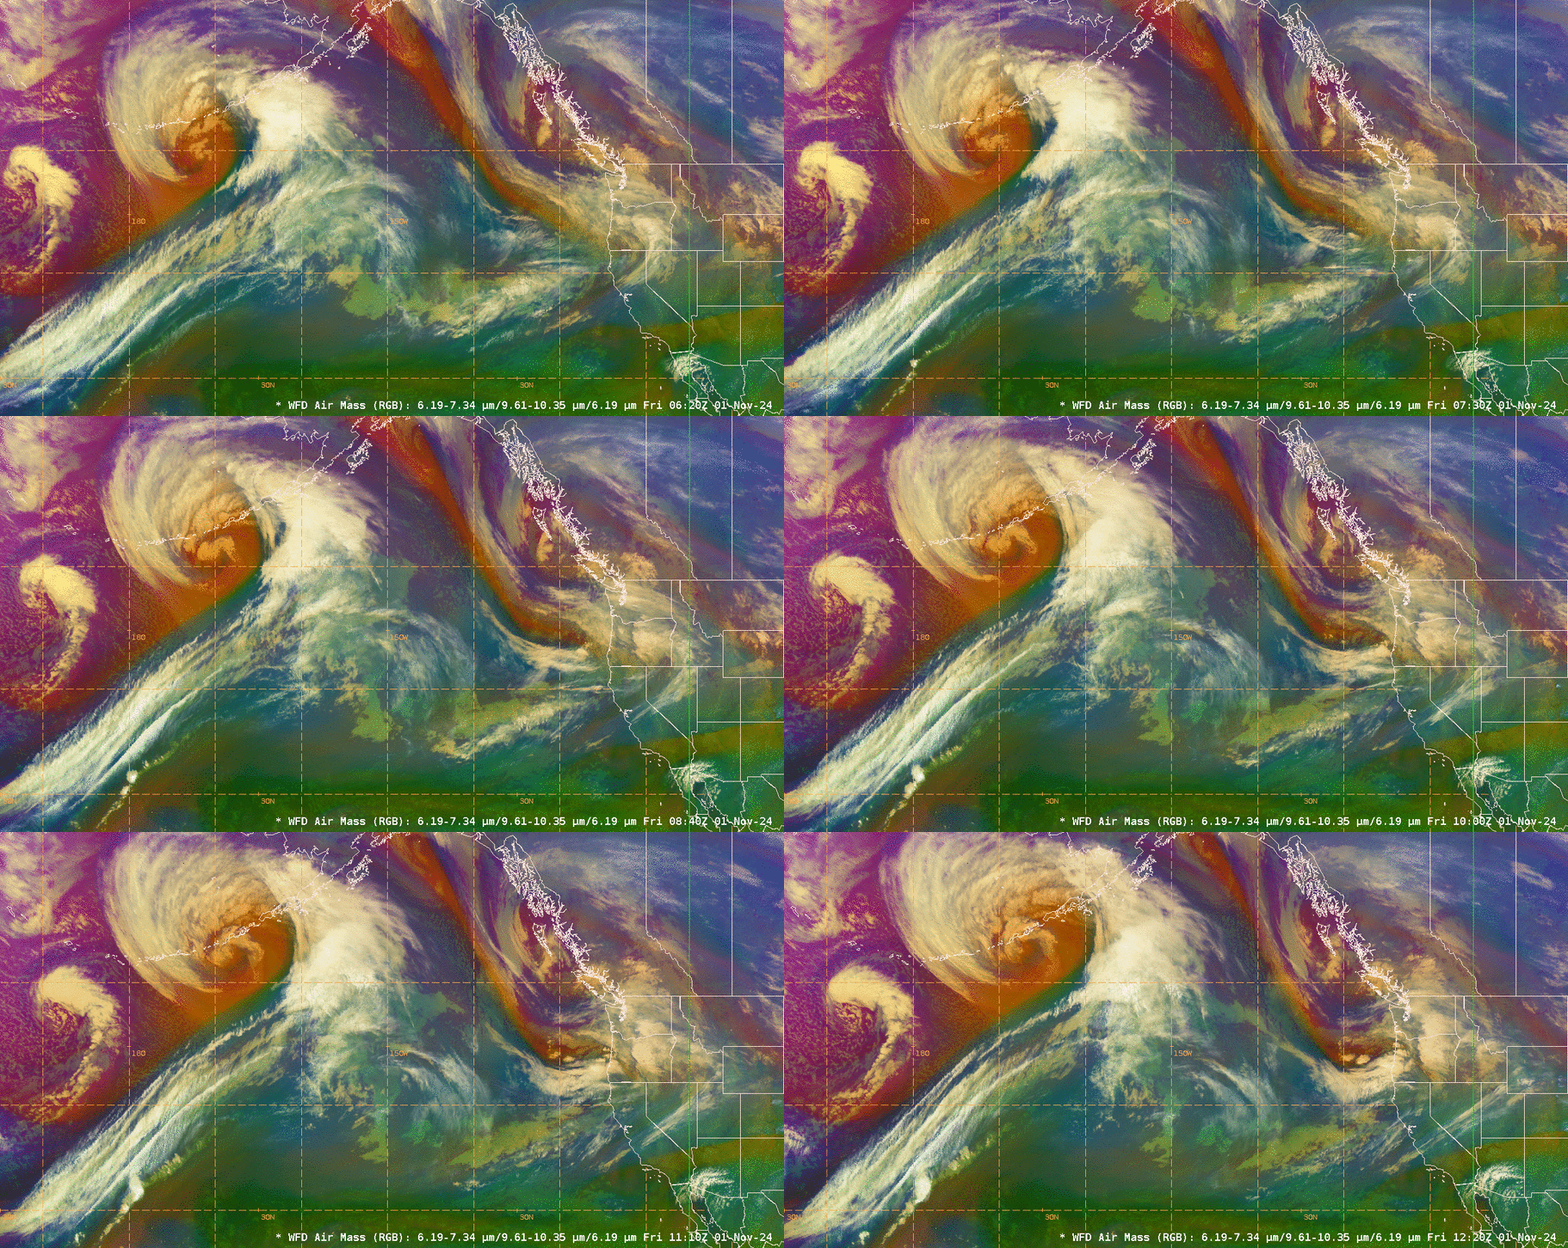
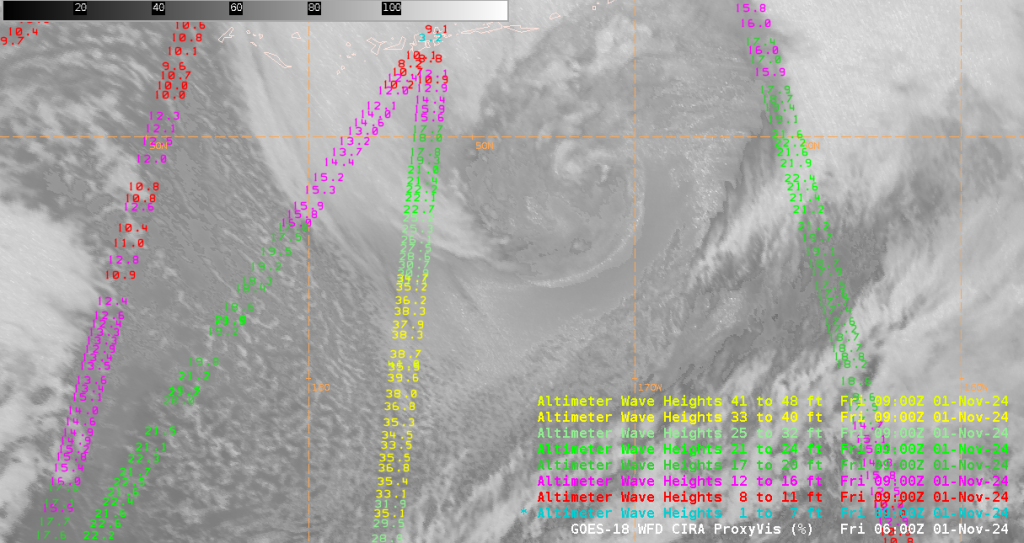
Significant wave heights observed by the Cryosat-2/SIRAL altimeter eclipsed 40 feet in the southwest quadrant at ~0600 UTC 01 November 2024. In addition, though the Metop-B/ASCAT wind retrievals were rain-flagged for two consecutive passes at 0711 UTC and 0851 UTC 01 November 2024, wind speeds near 70 kts. were found south of the circulation.
