The eastern Atlantic was the latest target for a pair of intense hurricane-force lows, both of which impacted Ireland. The first powerful system was introduced on the NWS Ocean Prediction Center (OPC) 96-Hour Surface Forecast Chart at 1601 UTC 19 January, valid for 1200 UTC 23 January 2025, with a developing hurricane-force low located over the Northeast Atlantic. A “developing hurricane-force” means hurricane-force winds are expected with the associated low pressure within the following 24 hours.

Indeed by 22 January 2025, the system began strengthening, drawing rich tropical moisture in the process. The CIRA Advected Layered Precipitable Water (ALPW) from ~2200 UTC 22 January to ~1400 UTC 24 January 2025 showed the moist air mass within the warm-conveyor belt region of the extratropical cyclone before being entrained into the entire circulation as the low pressure occluded. You’ll also notice a second surge of moisture towards the tailend of the period near Nova Scotia and Newfoundland, which would fuel the second hurricane-force low.

The Metop-C/ASCAT scatterometer captured the wind field of the first powerful hurricane-force low at ~2122 UTC 23 January 2025. A large area of hurricane-force winds (bright red barbs) up to 80 kts. can be seen in the western and southwestern quadrants as the system was just to the west of Ireland.

A Cryosat-2/SIRAL altimeter pass at 0230 UTC 24 January 2025 confirmed the strong winds were driving very large waves to develop, with significant wave heights up to 11.3 meters, or around 37 feet.

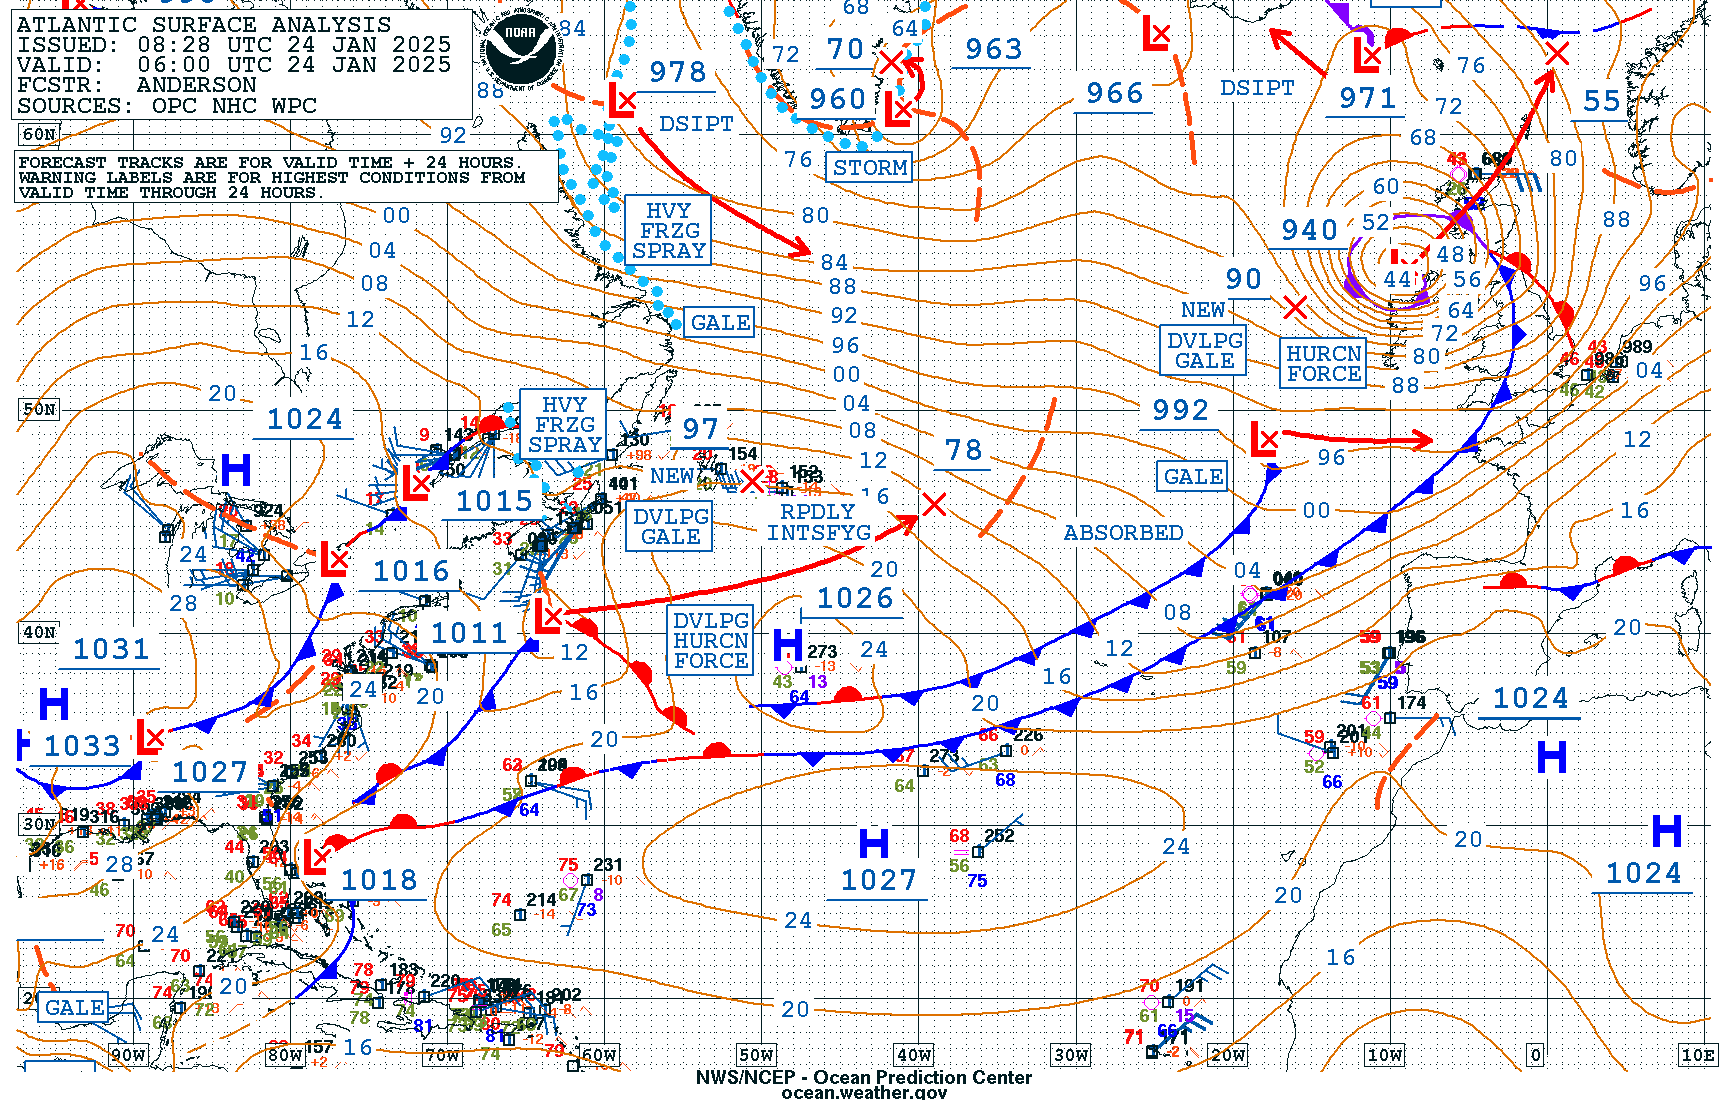
About 30 minutes later, a GCOM-W/AMSR2 pass provided an estimate of the ocean surface winds, with the strongest winds now due south of the low pressure’s circulation. Similar to ASCAT, estimated wind speeds topped out around 80 kts. The NWS OPC Surface Analysis at 0600 UTC 24 January 2025 showed a 940-mb hurricane-force low just off the western coastline of Ireland.

Less than 12 hours later, few vessels were seen tracking to the west of Ireland, with most still close to shore or passing to the south, offshore of Spain and Portugal. The next hurricane-force low was only about 24 hours away from impacting the waters offshore Ireland once again.

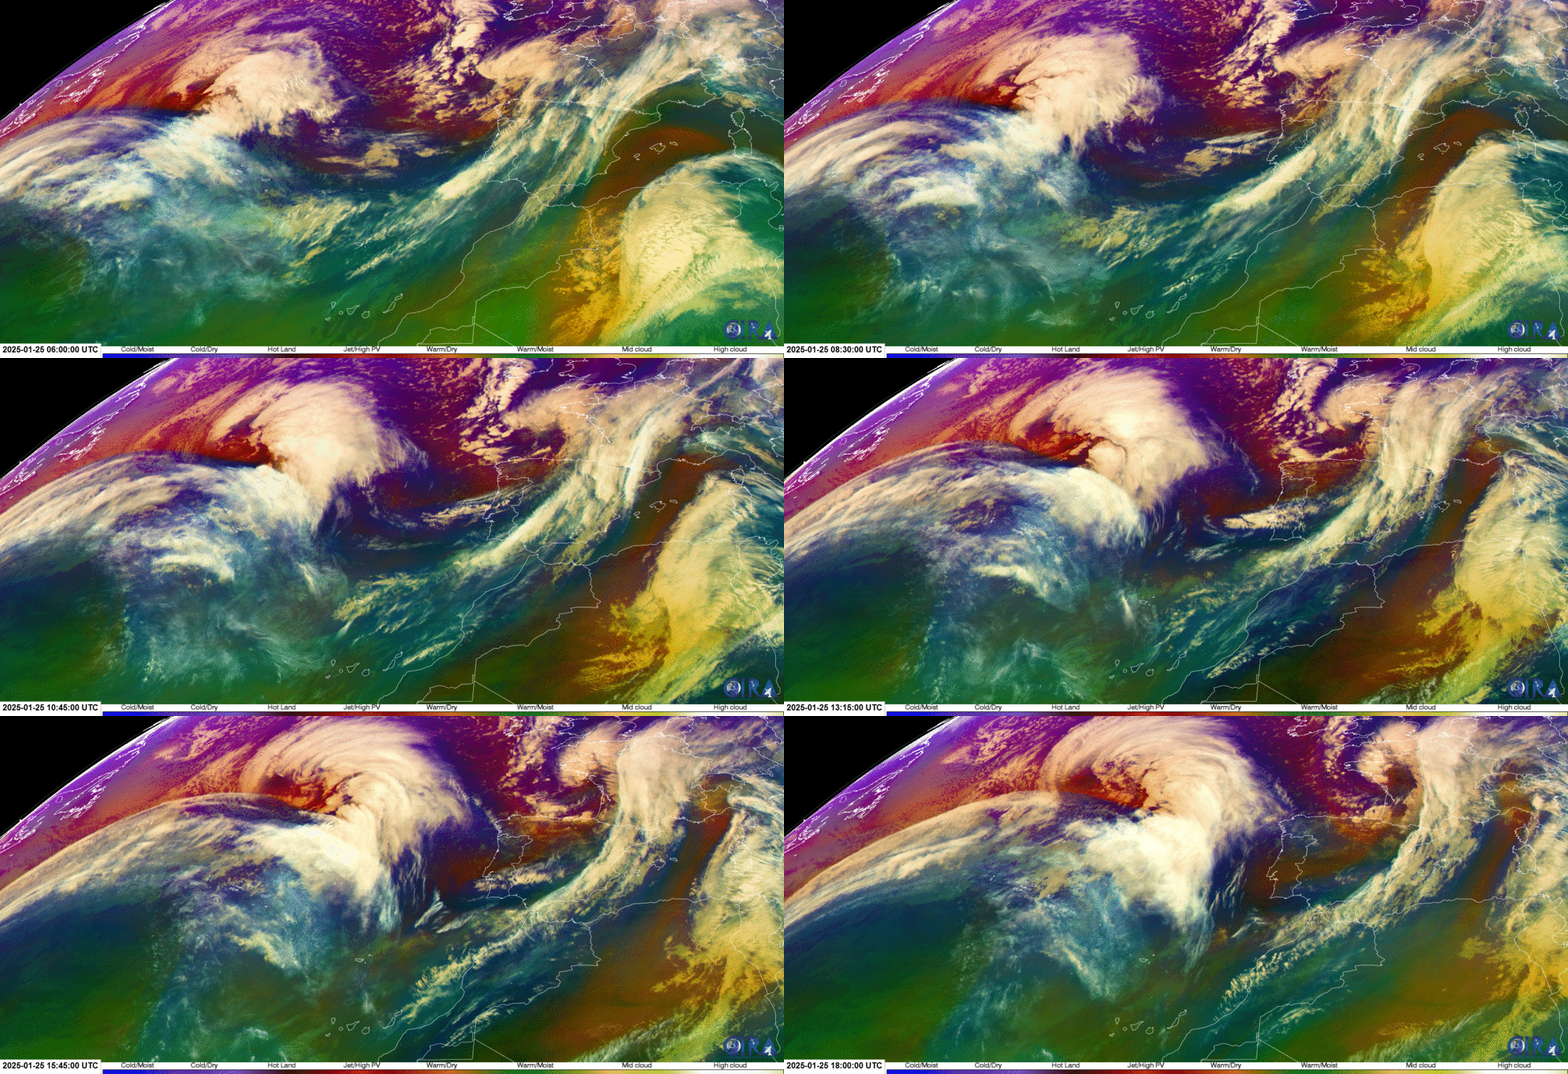
By 25 January 2025, the next hurricane-force low was marching through the Northeast Atlantic. Meteosat-10 Airmass RGB imagery provided a look at the rapid intensification of the extratropical cyclone, with its structure evolving from a baroclinic leaf-look to having a well-defined occlusion. The dark reds and oranges also signal high levels of potential vorticity (PV) fueling the intensification. Meteosat-10 Full Disk imagery has a temporal refresh of 15 minutes, but Meteosat-12 has 10-minute Full Disk scanning, which fully became operational on 04 December 2024, with imagery coming in the future to sites like CIRA Slider.
NESDIS/STAR has begun their 2025 Winter Season Winds Campaign, with a NOAA P-3 aircraft flying through intense systems that can help inform how processes such as the Ultra High-Resolution (UHR) ASCAT winds are performing. The Imaging Wind and Rain Airborne Profiler (IWRAP) aboard the P-3 provides Ku-band scatterometer retrievals, which can be compared to the UHR winds. In the graphic below, UHR ASCAT winds passes are provided in the top chart, with the P-3 flight path overlaid, while the bottom chart shows Flight Level, ASCAT UHR (and time difference to flight retrieval: color of the UHR diamond), and the Ku-band winds. You’ll note rather good agreement between the wind retrievals with little time difference (nearly white ASCAT UHR diamond color), with winds near 80 kts just after 1200 UTC 26 January 2025, on the south side of the low pressure circulation.

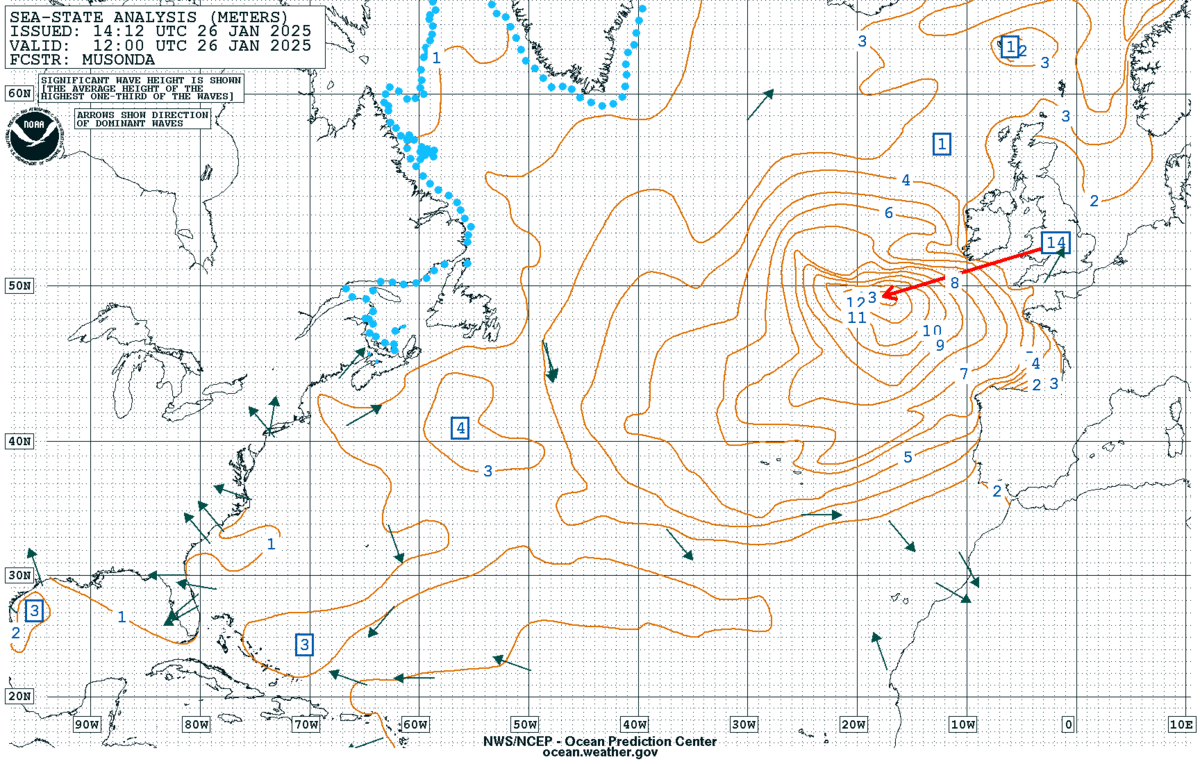
NWS OPC Sea-State Analysis at 1200 UTC 26 January 2025 had Significant Wave Heights up to 14 meters, or near a massive 46 feet, driven by the back-to-back powerful extratropical cyclones. The second hurricane-force low had a pressure bottom out around 949 mb, again just offshore Ireland, at 0000 UTC 27 January 2025.
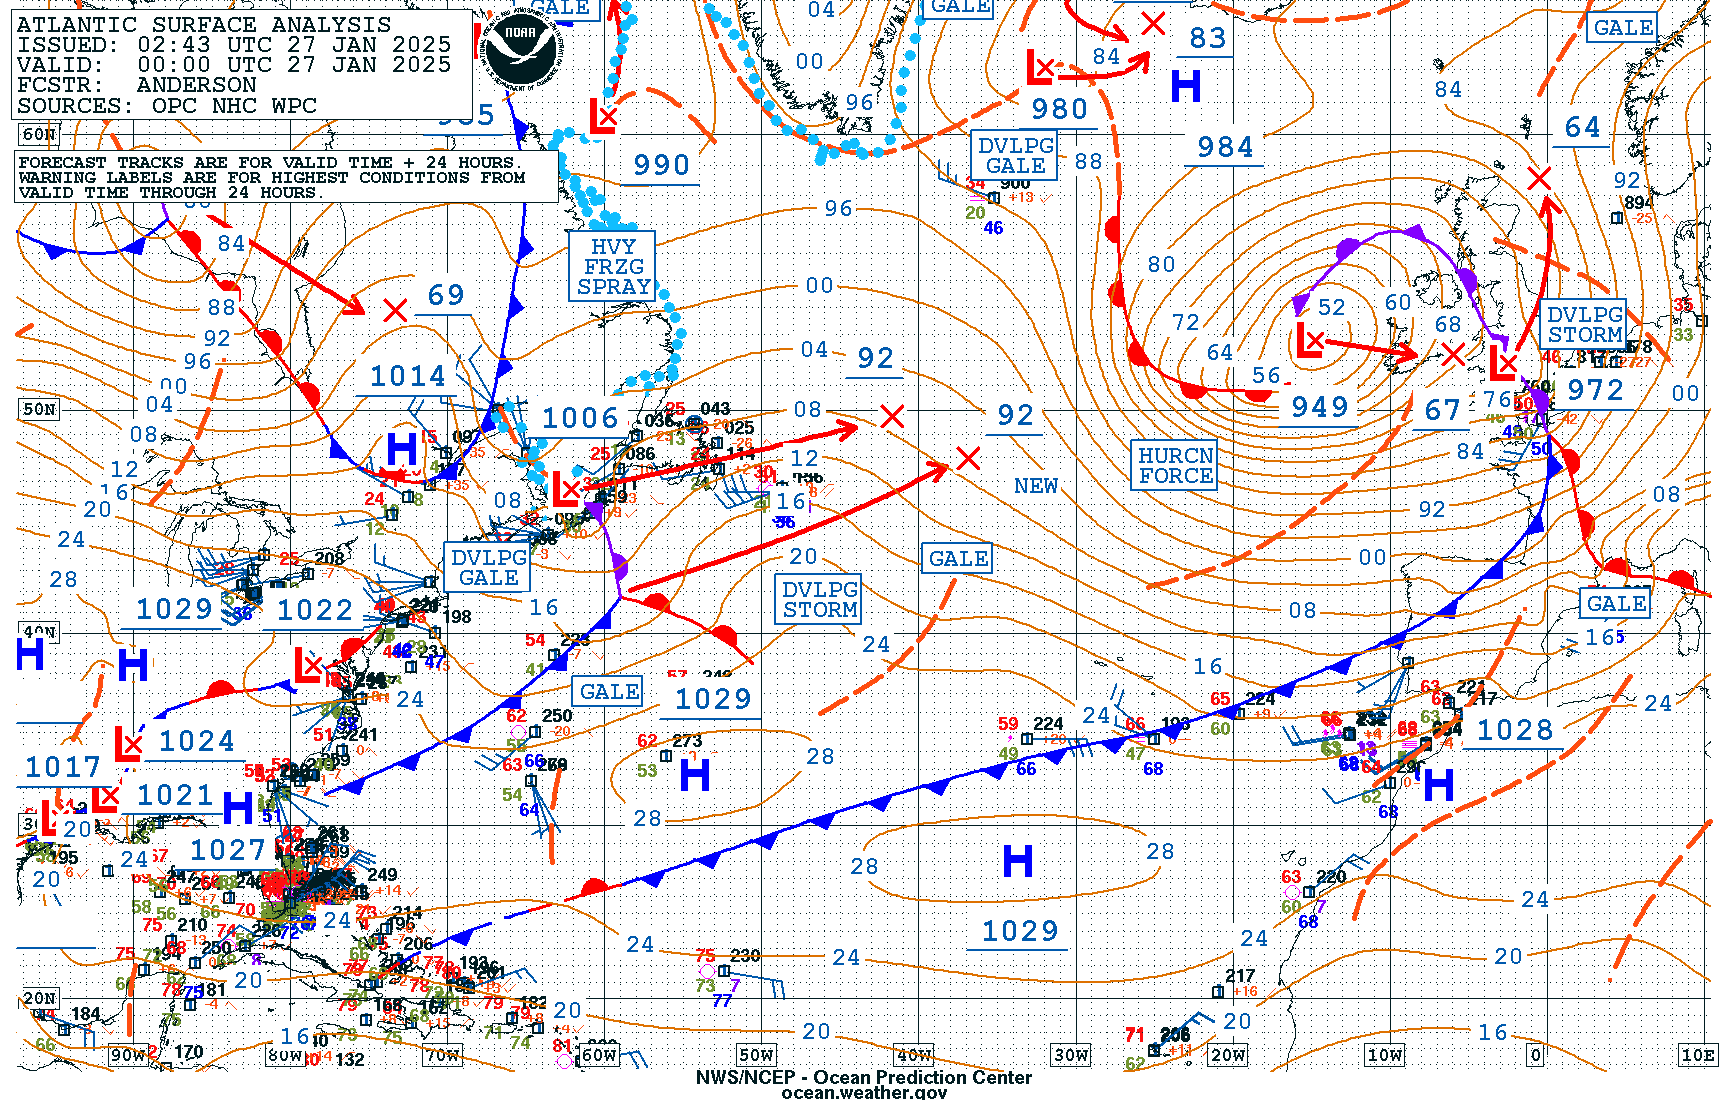
For more impacts on the first hurricane-force low, named Éowyn by the British Met Office, see Kim Erickson’s blog post on the power outages.


