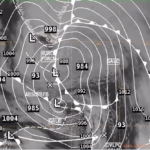
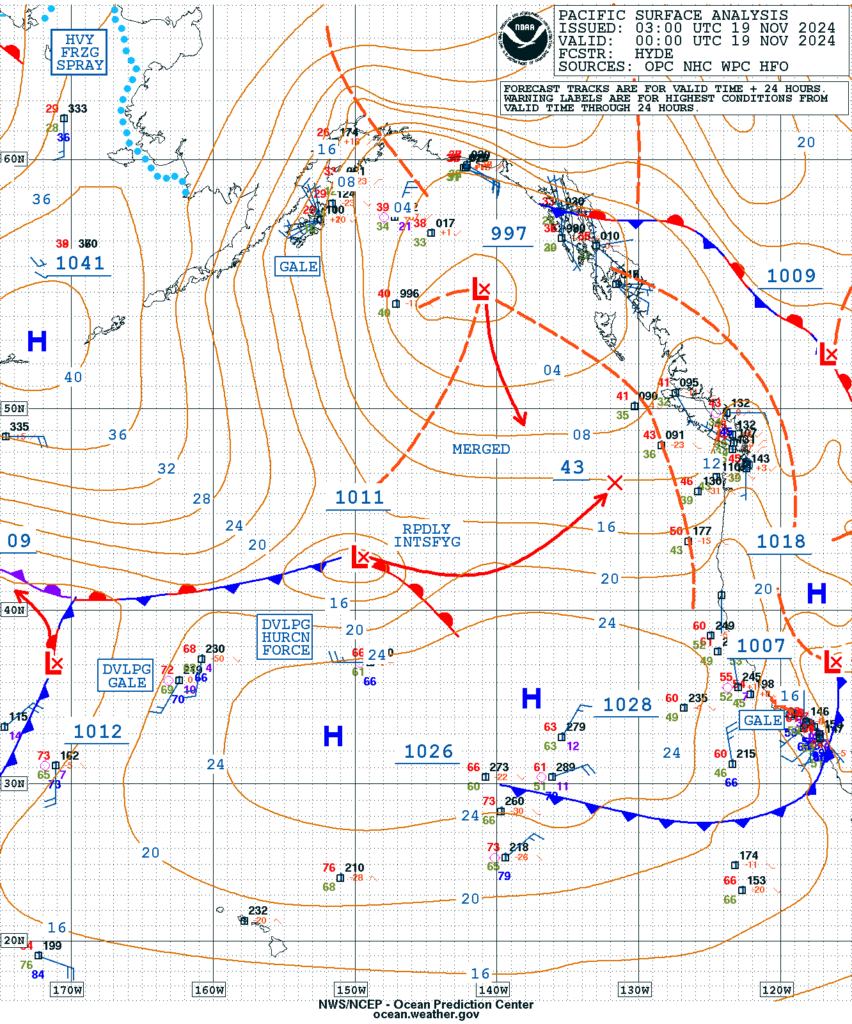
A rapidly intensifying extratropical cyclone developed in the Northeast Pacific this week, obtaining winds in excess of hurricane-force. The low pressure system underwent a remarkable period of strengthening, with its minimum central pressure dropping a whopping 64 mb in 24 hours, from 1011 mb at 0000 UTC 19 November to 945 mb just 24 hours later. The pressure drop at 44.5 degrees North latitude was equivalent to 3.4 Bergeron, a scale developed by Tor Bergeron and further refined by Sanders and Gyakum to define ‘bomb’ cyclones. For the latitude of 44.5 degrees North, 1 Bergeron represents a 24-hr pressure drop of ~19.6 mb.

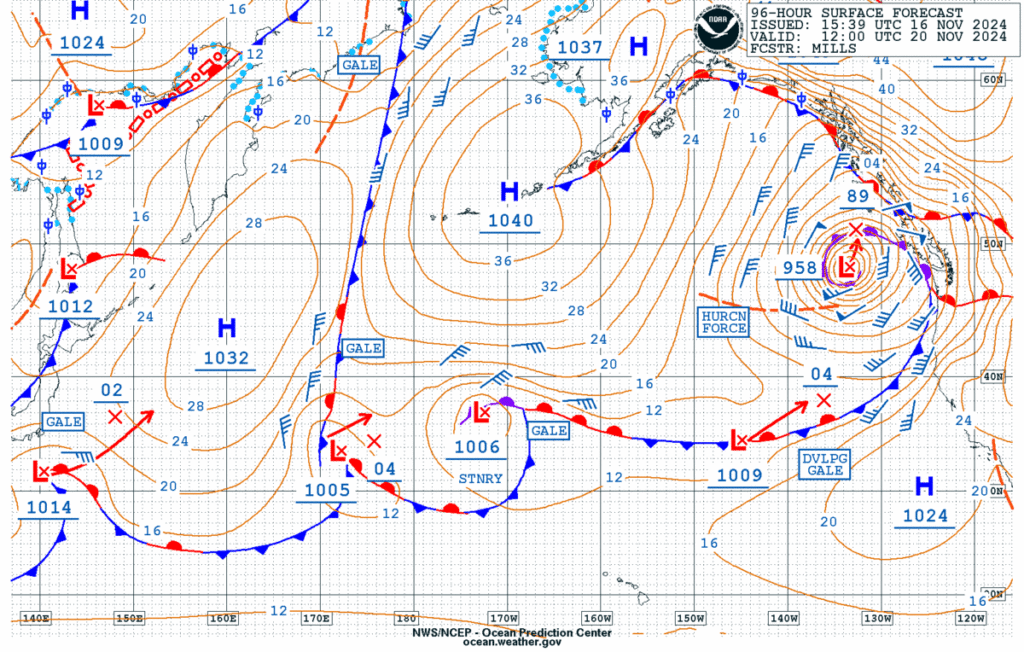
The NWS OPC had forecast this powerful system well in advance, providing crucial leadtime to mariners to make avoidance plans. The North Pacific 96 Hour Surface Forecast issued on 16 November indeed had a 958 mb hurricane-force low off the Pacific Northwest Coast at 1200 UTC 20 November 2024.
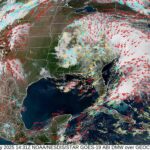
On 19 November 2024, satellite imagery was crucial in confirming that rapid intensification was underway. GOES-West Airmass RGB imagery showcased the dynamic setup, with a cold, arctic airmass diving south (deep purples) and a tropospheric fold upstream providing high levels of Potential Vorticity (PV) (dark reds) to fuel the system’s strengthening. From ~1000 UTC to ~2000 UTC 19 November 2024, the extratropical cyclone underwent significant structural changes, starting from the classic ‘baroclinic-leaf’ representation before transforming into a powerful extratropical cyclone, with a well-defined occlusion. The stratopsheric, rich-PV air can be seen as a ribbon being entrained into the system as it rapidly intensified.

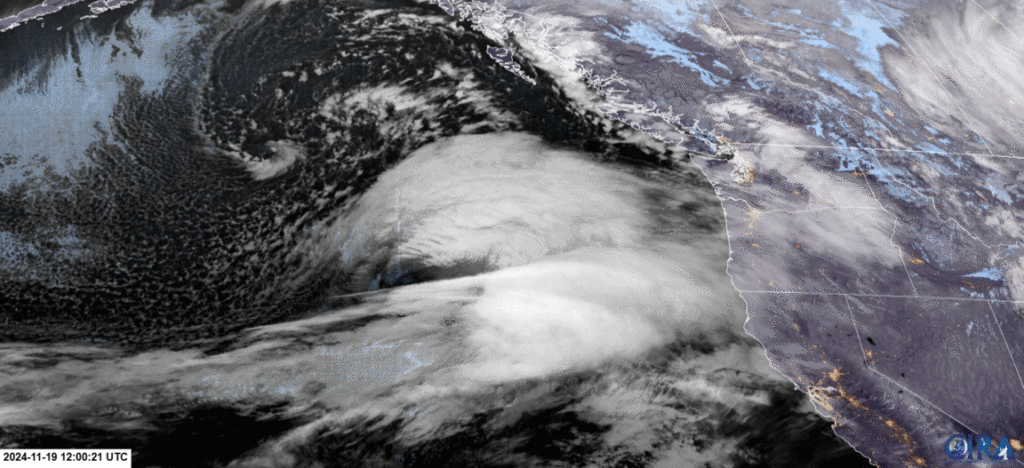
The hurricane-force low’s development was also captured by GOES-West GeoColor imagery, with a well-defined occlusion seen as the sun rose over the powerful system.
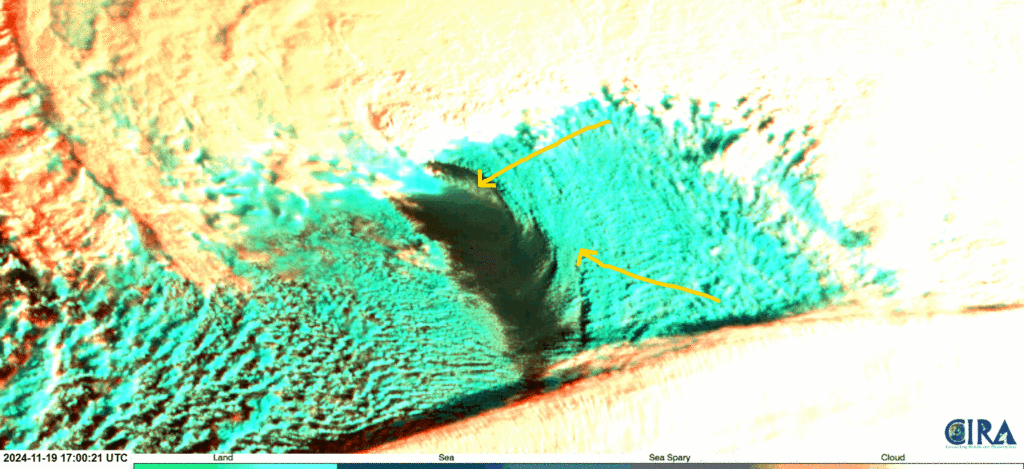
GOES-West imagery was also able to identify a threat to mariners, sea spray. The Sea Spray RGB mid-cyan to gray colors representing sea spray were in the cloud-free region south of the low pressure circulation, where winds are often strongest in intense extratropical cyclones. The gold arrows point to areas of focus for the signature before clouds (bright cyan and white colors) move overhead.
GCOM-W/AMSR2 microwave radiometer provided a look at the wind field of the system at 1946 UTC 19 November 2024. Although AMSR2 wind speeds are only reliable up to 30 m/s, or about 58 kts, there’s still a signal for hurricane-force winds in excess of 64 kts, especially on the southern side of the circulation.

The extratropical cyclone maintained hurricane-force winds into 20 November 2024. A Metop-B ASCAT pass at ~0450 UTC observed winds in excess of 64 kts in the southeast quadrant, with a large field of storm-force winds to the north and east.

The strong winds drove the development of very large waves as well. A Sentinel-3B pass around ~0600 UTC 20 November 2024 showed significant wave heights approaching a massive 38 feet just to the north of the low pressure center.

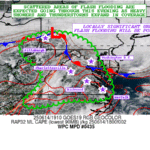
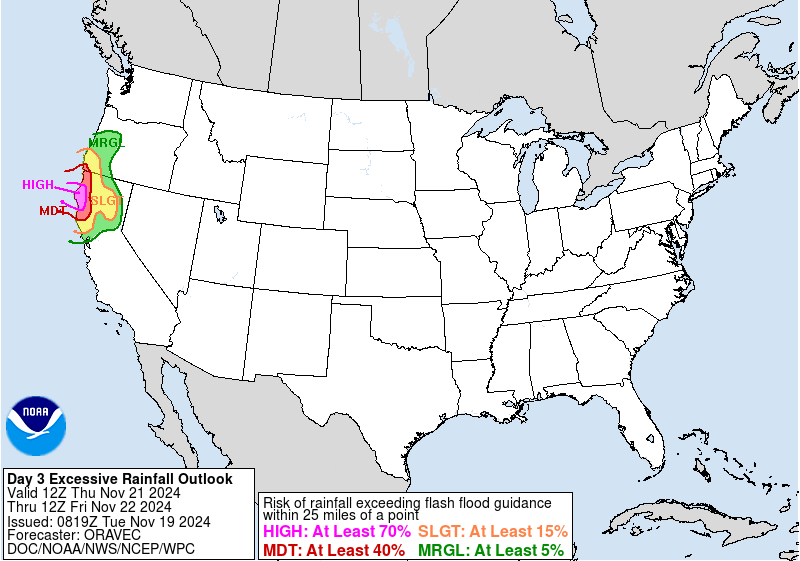
The proximity of the powerful low to the Pacific Northwest Coast meant that maritime hazards weren’t the only threats. A strong atmospheric river was centered on the northern California Coast, leading to multiple days of heavy rainfall. The NWS Weather Prediction Center (WPC) issued a rare Day 3 High Risk Excessive Rainfall Outlook (ERO), valid 1200 UTC 21 November through 1200 UTC 22 November 2024.
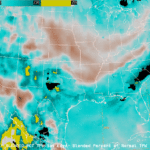
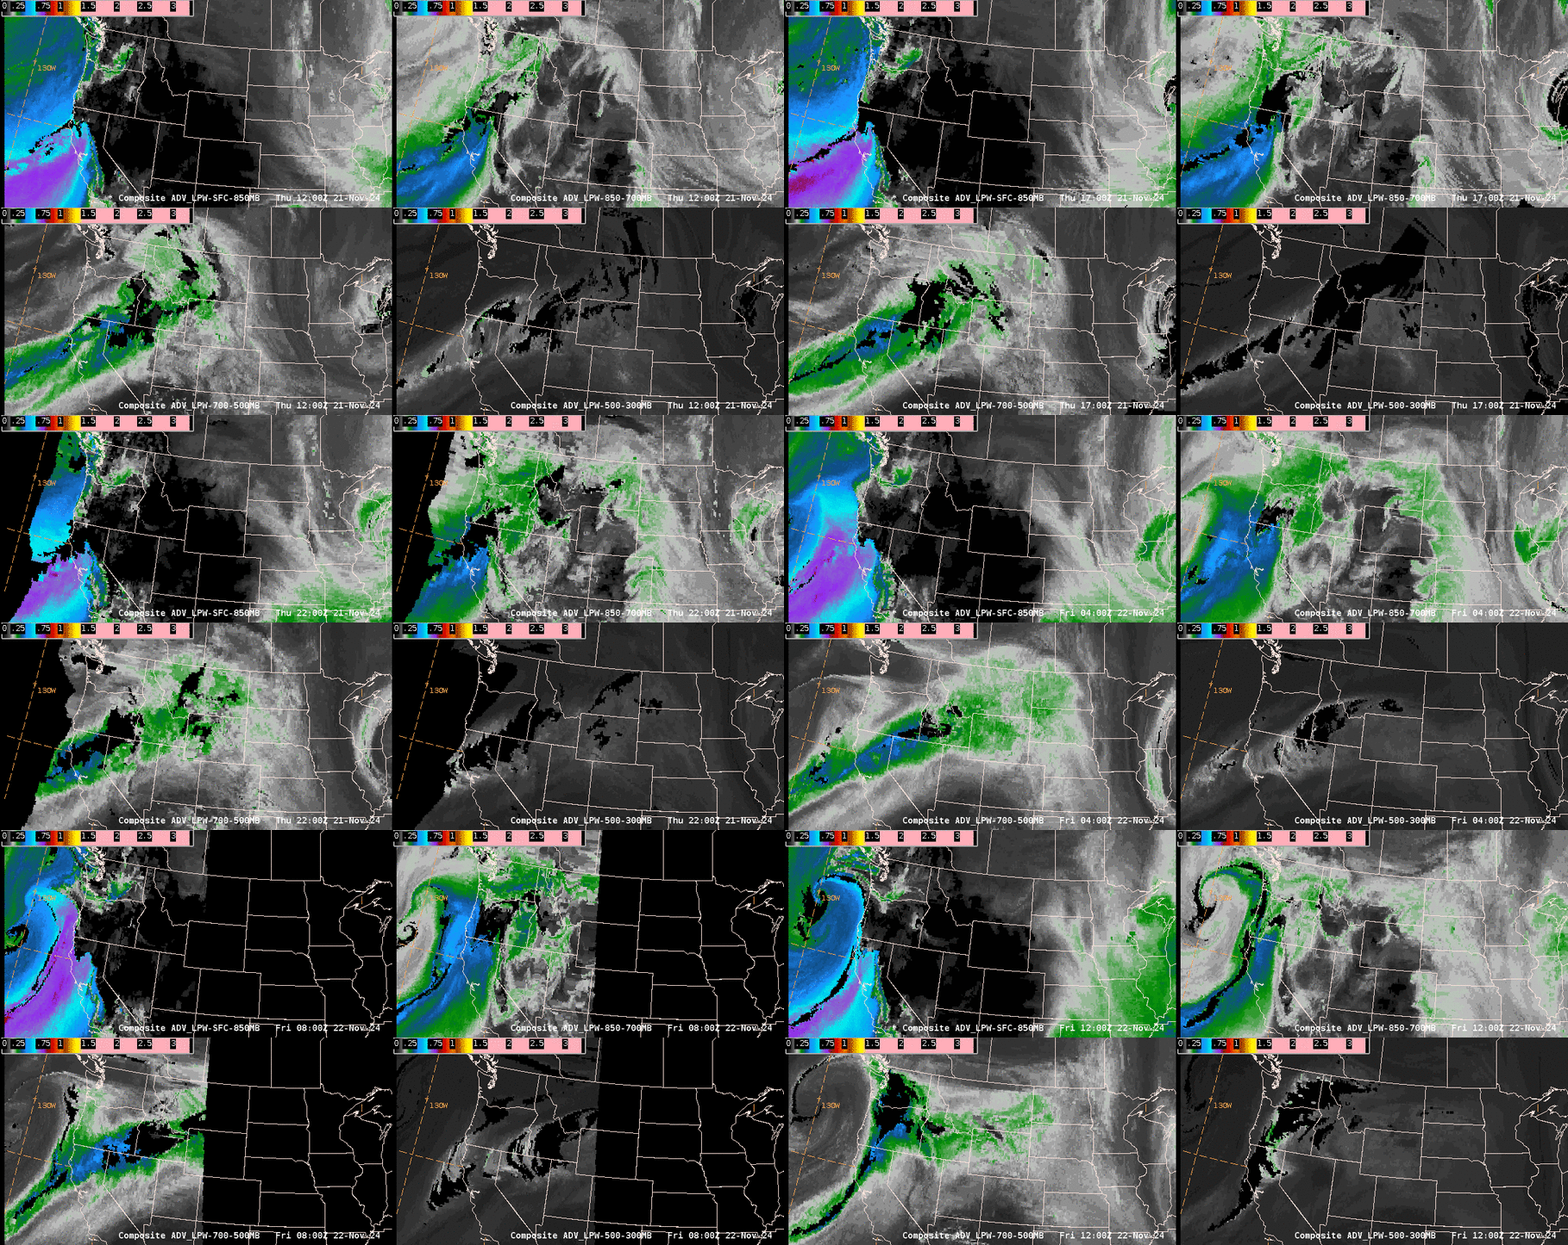
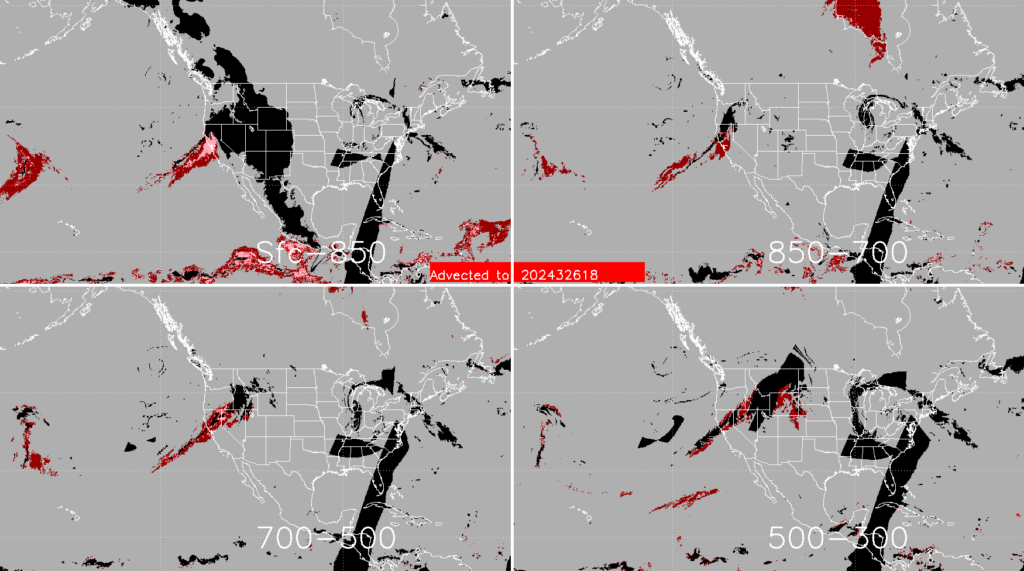
The CIRA Advected Layered Precipitable Water (ALPW) showed the transport of moisture into Northern California from 1200 UTC 21 November to 1200 UTC 22 November 2024. When summing all of the layers, PW values approached 1.5″ at times. The CIRA Experimental ALPW Percentile Rankings product, based on a 10-year Monthly average, confirmed the PW values were anomalously high, exceeding the 95th percentile for all layers (dark red), and even the 99th percentile (light pink) for the Surface-850 mb layer, an important ingredient for heavy rainfall. The CIRA ALPW Product is now available via the NESDIS Common Cloud Framework (NCCF), and the operational feed will be implemented in AWIPS in 2025.
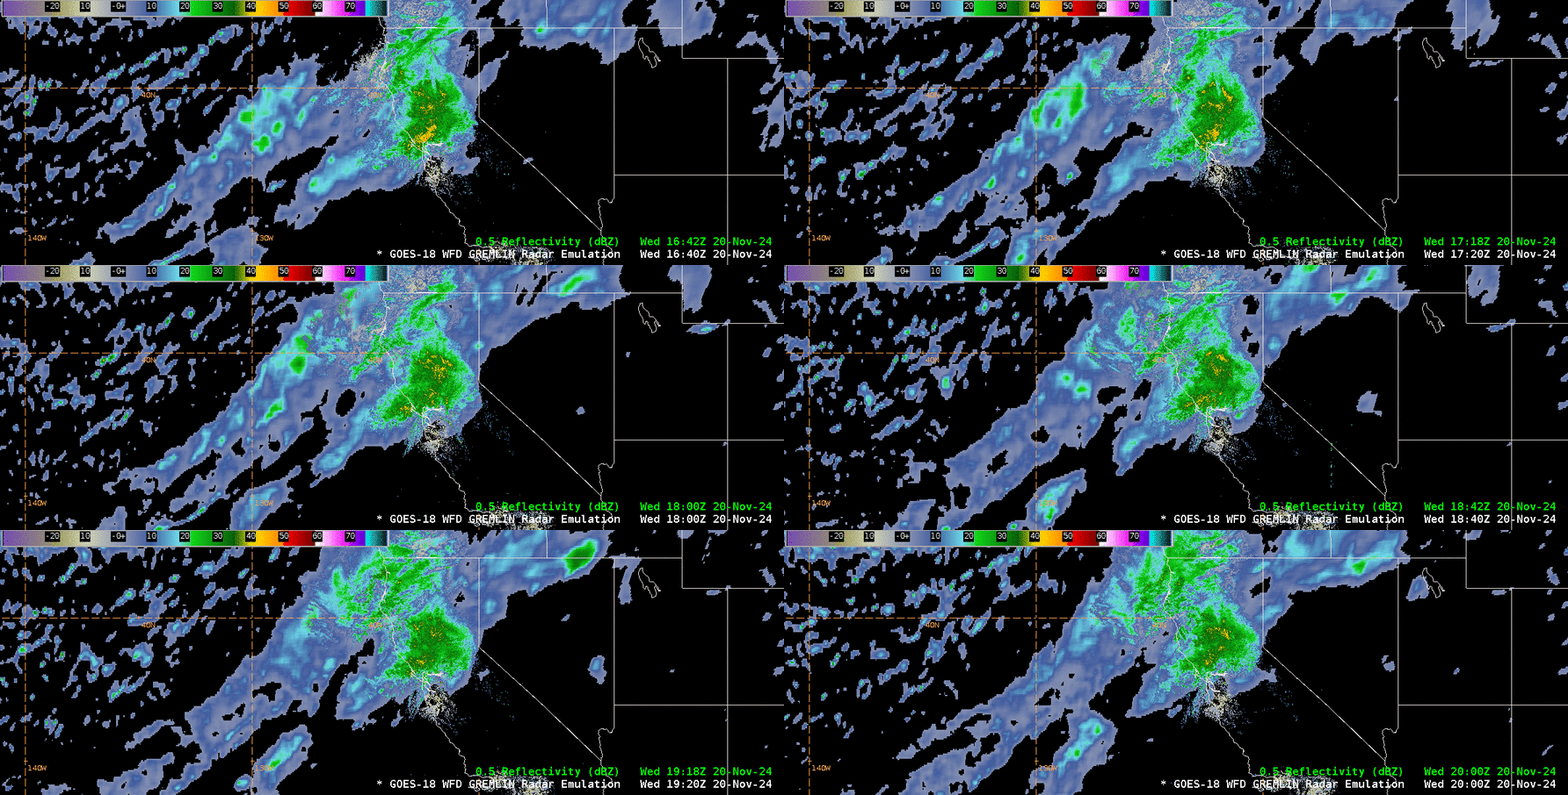
GOES-West Full Disk GREMLIN product output provided an estimation of rainfall rates as precipitation pushed ashore. In general, GREMLIN seemed to underestimate reflectivities compared to ground-based radar (overlaid in the animation), but the product was still useful in identifying areas of more concentrated and heavier rainfall as moisture pushed inland.
According to the NWS WPC, over 17 inches of rain fell in Venado, CA, from 1400 UTC 19 November to 1400 UTC 22 November 2024, while wind gusts exceeded hurricane-force in CA, OR, & WA.


