")
Headlines:
- A La Nina pattern dominates the tropics in the annual anomaly map
- The 2025 anomaly pattern again reinforces the long-term precipitation trend pattern
- While the global precipitation total for 2025 is below its long-term mean as expected for a La Nina situation, the annual surface temperature mean remains above the temperature trend line, unusual for La Nina conditions
The year 2025 was characterized on a global scale as one of the warmest on record in terms of surface temperature (only 2024 was warmer and 2025 was essentially tied with 2023). This was keeping with the obvious global warming trend of recent decades. In terms of global precipitation totals (with no significant trend over those same decades) the mainly La Nina conditions of 2025 produced a slight negative anomaly for the globe as a whole, with a typical La Nina anomaly separation between ocean (negative) and land (positive). See Table 1.
Table 1. Global mean precipitation (mm day-1) from GPCP V3.2.
1983-2024 | 2025 | Anomaly | |
Land+Ocean | 2.81 | 2.79 | -0.02 |
Land | 2.28 | 2.35 | +0.07 |
Ocean | 3.06 | 2.99 | -0.07 |
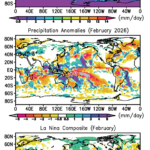
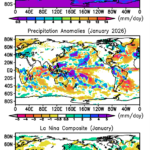
The maps in Fig. 1 show the mean precipitation distribution for 2025 (top panel) showing the main climatological features that repeat each year and the anomaly pattern from climatology for the year (middle panel). Striking in the anomaly pattern is the intense and large positive area centered over the Maritime Continent with tendrils extending outward in multiple directions. To the east of there an intense negative feature with a core near the Equator at 160°E closely counters the wet anomaly to the west. And this negative core has attached extensions stretching to the east and southeast. These key features are, of course, related to the ocean-atmosphere phenomenon of La Nina and its negative SST feature along the Equator centered in the central and eastern Pacific during 2025 (not shown). The resulting shift of the Walker circulation drives the shift in large-scale vertical motions and the resulting rainfall patterns.
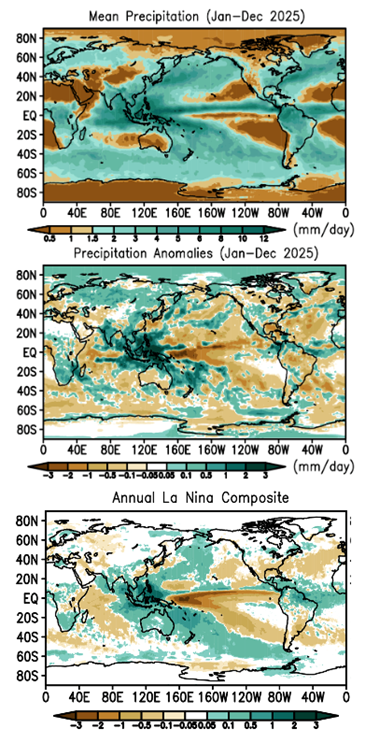
The annual composite anomaly map for La Nina conditions is shown in the bottom panel of Fig. 1 and matches well with 2025 anomalies over the regions just described. The spatial correlation between the two fields (40°N-40°S) is +0.66. The mean Nino 3.4 SST Index was -0.4K for 2025, indicating relatively weak La Nina covering the year, although the Relative Nino Index (taking into account the climatological warming ocean) is a larger negative, -0.7K. This relatively weak La Nina situation is reflected in some regions as we move away from the core areas and compare to the composite. Over oceans the 2025 anomaly map has weaker, less continuous features than the composite, e.g., to the east along the ITCZ and in the negative and positive swaths to the southeast to the southern tip of South America and the Magellan Strait. Over land some areas have clear connections to the La Nina composite with resulting impacts on life in these areas. Over the Maritime Continent the strong positive anomaly was associated with intense regional and local rain events and flooding and landslides, including from tropical cyclones, over India, Indochina, the Philippines, Malaysia and Indonesia. Even northeast Australia had some flooding, although as a whole, Australia in 2025 was not covered by positive anomalies as is typical with La Nina conditions.
The western Indian Ocean was mainly dry in 2025 with that feature extending to the southeast as in the composite and with dry conditions covering the Horn of Africa and the Middle East. Southern Africa shows wet in both the 2025 and composite maps.
South America continues to have dry conditions over the Amazon and does not match the La Nina composite, although conditions in the tropical and mid-latitude Atlantic Ocean do seem to match. Over North America the La Nina-expected conditions are not apparent in the observed data. At higher northern latitudes the anomaly map shows positive values across most of northern Asia, Alaska and Arctic Ocean. This feature is related mainly to the trend of increased precipitation in these regions related to increased moisture with global warming.
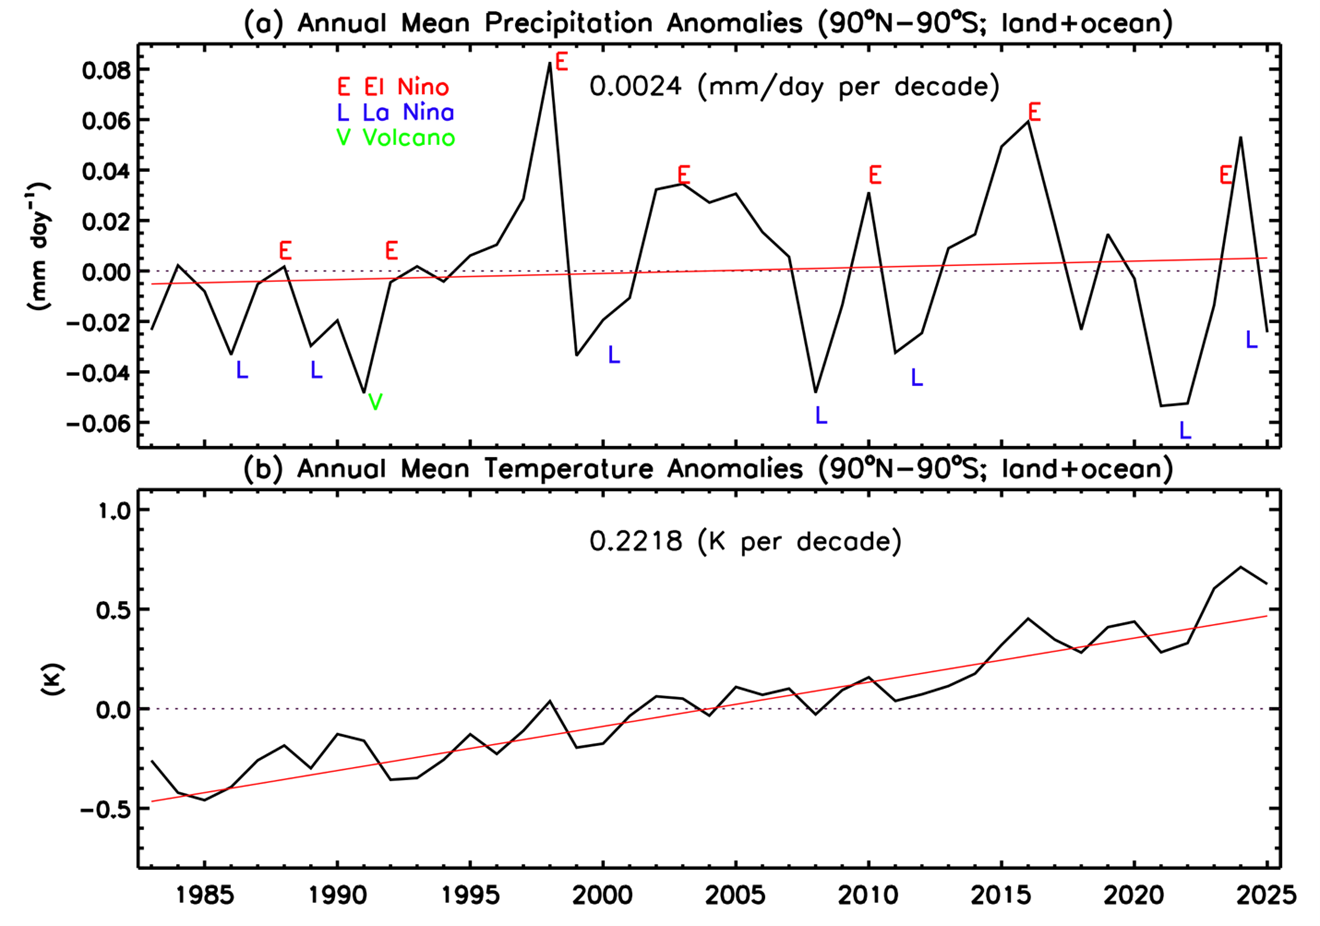
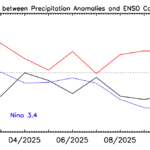
How does the global precipitation total for 2025 fit with the multi-decade record of both precipitation and surface temperature? Figure 2 shows the time history of annual anomaly values of the two variables and the connection of the anomalies of global precipitation and the anomalies of surface temperature from the long-term trend of that variable. For 2025, despite it being a La Nina year, the surface temperature anomaly relative to the trend is positive, while the precipitation anomaly is negative. This pairing is unusual and may reflect an intensification of the global warming signal. It will be interesting to monitor that relationship over the coming year or two.
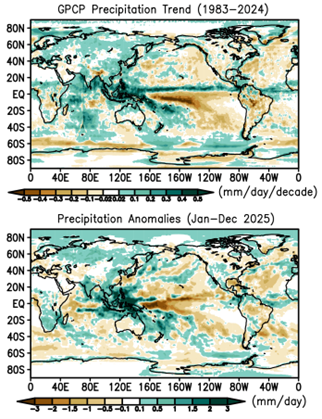
While global total precipitation does not show a significant trend (unlike global temperature), there are significant regional trends (both positive and negative) in precipitation as seen in Fig. 2 (top panel) covering the GPCP period (1983-2024). Climate models forced by varying SSTs over the past decades roughly reproduce the main features in the observed trend map. Does the anomaly map for 2025 reinforce the regional trend signal? A quick glance shows that the trend map bears some similarities with the 2025 anomaly map (repeated here in Fig. 3, bottom panel). In fact, the trend map looks like a La Nina pattern over at least the Maritime Continent and tropical western Pacific. The correlation between the two maps in the tropics (40°N-40°S) is +0.37, indicating a trend reinforcement. The 2025 anomaly map also reinforces the trend pattern over South America. Over the continental U.S. there is a mismatch, but further north Canada and Alaska seen to have the same sign between the trend and 2025 anomaly. The same is true over northern Asia.
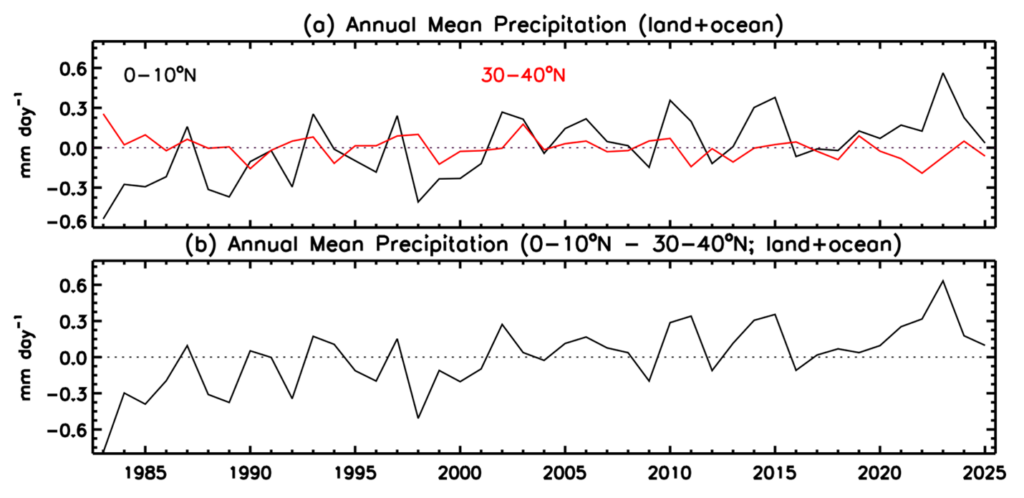
Large-scale regional trends continue, especially in the tropics. Figure 4 shows the trends in two latitude belts with the ITCZ-containing 0-10°N increasing and the sub-tropic dry zone 30-40oN decreasing with time, making for an increased gradient between the two zones. ENSO dominates the inter-annual variations as expected, but the curve of the difference between the two bands (bottom panel) has the 2025 value above the mean for the entire period. This is a clear, large-scale case of the “wet getting wetter, dry getting drier.”
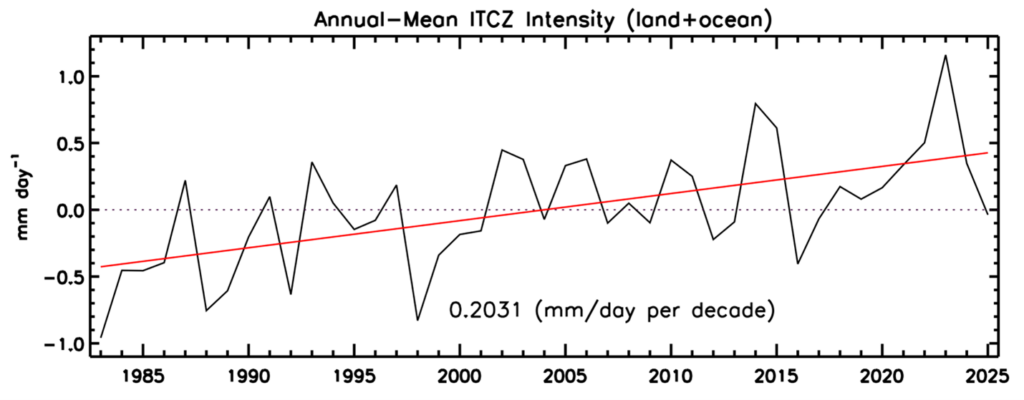
In terms of rainfall intensity on a large-scale, Fig. 5 takes a close look at the intensity of the ITCZ by averaging the maximum annual mean rain rate at each longitude (0.5o latitude-longitude resolution) and then averaging those values around the ITCZ, over both land and ocean. The trend in this intensity is obvious, and although 2025 has a relative low value due to the La Nina, the 2025 value is at the mean value for the entire period, higher than the other La Nina years.
The Global Precipitation Climatology Project (GPCP)
This global precipitation summary is based on V3.2 of the Monthly Global Precipitation Climatology Project (GPCP) product, an observation-based analysis using satellite observations over oceans and satellite and rain gauge observations over land. The Monthly analysis extends from 1983 to the near present as a Climate Data Record (CDR) with an extension to the previous month (within ~ 12 days of the end of the month) as an Interim CDR, or ICDR.
The development of the GPCP CDR products (Monthly and finer time scales) is supported by NASA’s MEaSUREs program. The GPCP Monthly ICDR was developed and its routine calculation is supported by NOAA’s National Center for Environmental Information (NCEI). GPCP products are available at NASA’s Goddard Earth Sciences Data and Information Services Center (GES DISC) and from NOAA NCEI.
The following references describe GPCP products in detail and provide additional research results using GPCP by the authors of this summary:
GPCP V3.2 paper:
Huffman, G. J. and R. Adler, A. Behrangi, D. Bolvin, E. Nelkin, G.Gu and M. Ehsani, 2023. The New Version 3.2 Global Precipitation Climatology Project (GPCP) Monthly and Daily Precipitation Products. J. Climate, 36, 7635- 7655. DOI: 10.1175/JCLI-D-23-0123.1.
GPCP V2.3 paper:
Adler, R., M. Sapiano, G. Huffman, J. Wang, G. Gu, D. Bolvin, L. Chiu, U. Schneider, A. Becker, E. Nelkin, P. Xie, R. Ferraro, D. Shin, 2018. The Global Precipitation Climatology Project (GPCP) Monthly Analysis (New Version 2.3) and a Review of 2017 Global Precipitation. Atmosphere. 9(4), 138; doi:10.3390/atmos9040138
Other references:Adler, R., G. Gu, M. Sapiano, J. Wang, G. Huffman 2017. Global Precipitation: Means, Variations and Trends During the Satellite Era (1979-2014). Surveys in Geophysics 38: 679-699, doi:10.1007/s10712-017-9416-4 Adler, R. F., G. Gu, G. J. Huffman, R. P. Sapiano and J. Wang, 2020: GPCP and the Global Characteristics of Precipitation. In Satellite Precipitation Measurement, Vol. 2, Chapter 35, 677-697. Advances in Global Change Research, 69, Springer Nature, doi:10.1007/978-3-030-35798-6_11.
Gu, G., and R. Adler, 2023. Observed Variability and Trends in Global Precipitation During 1979-2020. Climate Dynamics, 61, 131-150.
Adler, R. and G. Gu, 2024. Global Precipitation for the Year 2023 and How It Relates to Longer Term Variations and Trends. Atmosphere, 15(5). 10.3390/atmos15050535.
Gu, G. and R. Adler, 2024. Variability and Trends in Tropical Precipitation Intensity in Observations and Climate Models. Climate Dynamics, https://doi.org/10.1007/s00382-024-07287-y.