University of Maryland

Storm-Force Low Tracks Across Western Atlantic

UMD/ESSIC/CISESS GOES-R Satellite Liaison for NWS WPC

The NWS Ocean Prediction Center (OPC) waters are increasingly becoming winter-like, buzzing with intensifying extratropical cyclones. The latest example came last week out of the Western Atlantic as the remnants of Tropical Storm Oscar reintensified along the Gulf Stream to become a storm-force low at 0600 UTC 24 October 2024.
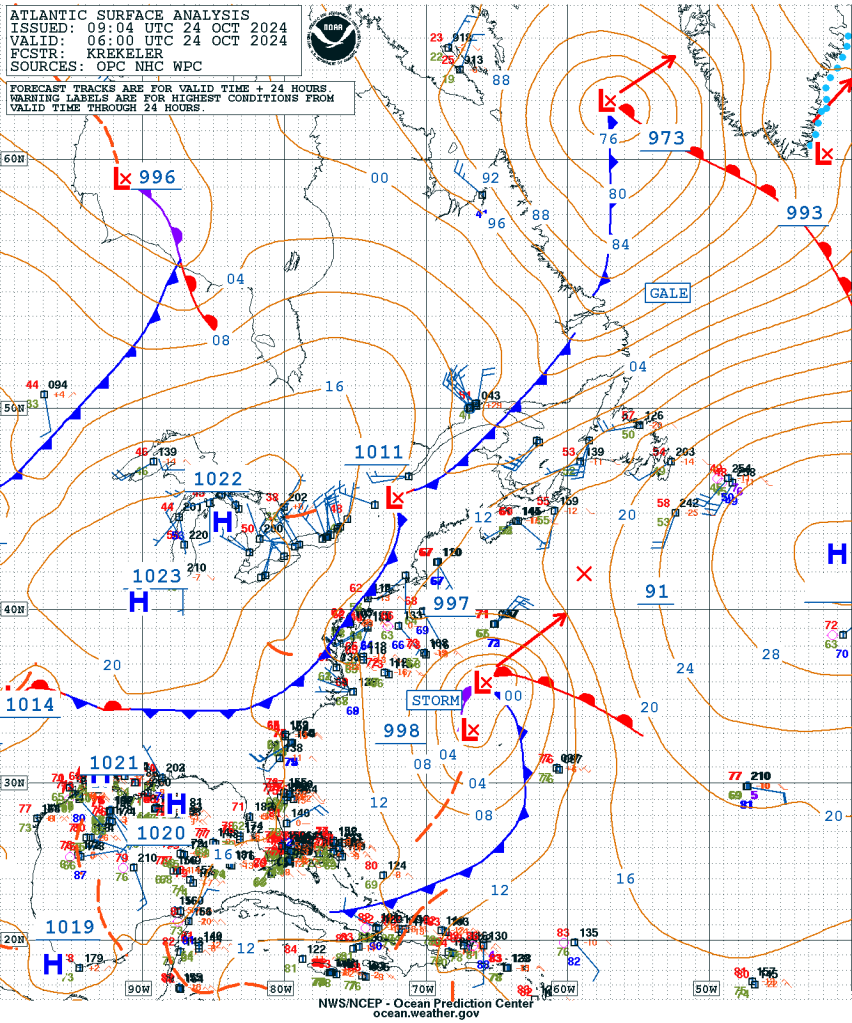
Figure 1: OPC Western Atlantic Surface Analysis valid 0600 UTC 24 October 2024.

GOES-East Air Mass RGB imagery captured the complex extratropical cyclone at 0600 UTC 24 October 2024, with the elongated double-barrel low pressures, connected by a bent-back occluded front. Between the convection on the western side of the system and the well-defined cold front to the east, dark oranges and reds signaled an intrusion of stratospheric air with high levels of potential vorticity, helping to fuel the intensifying extratropical cyclone.
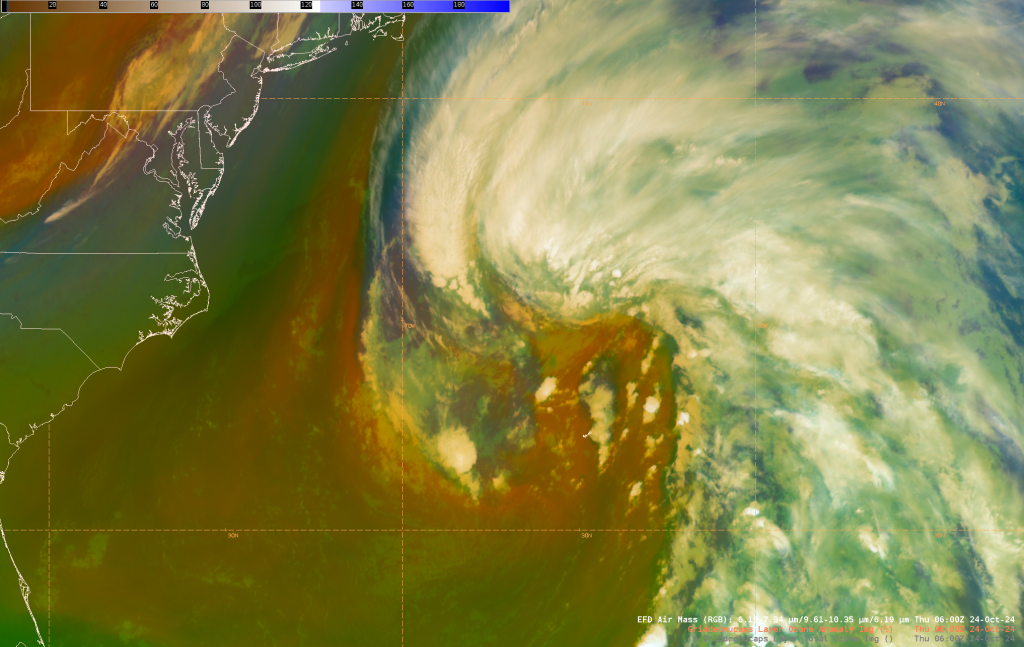
Figure 2: GOES-East Air Mass RGB imagery valid 0600 UTC 24 October 2024. This image was exported from AWIPS.

At the same time, Gridded NUCAPS was available over the system. When combining all layers for the Total Atmosphere, an impressive ozone anomaly can be seen in the area of the storm-force low, confirming that the dark reds and oranges in the Air Mass RGB imagery represent an intrusion of stratospheric air. Ozone anomalies were as high as 160 to 180 percent of normal over much of the Western Atlantic.
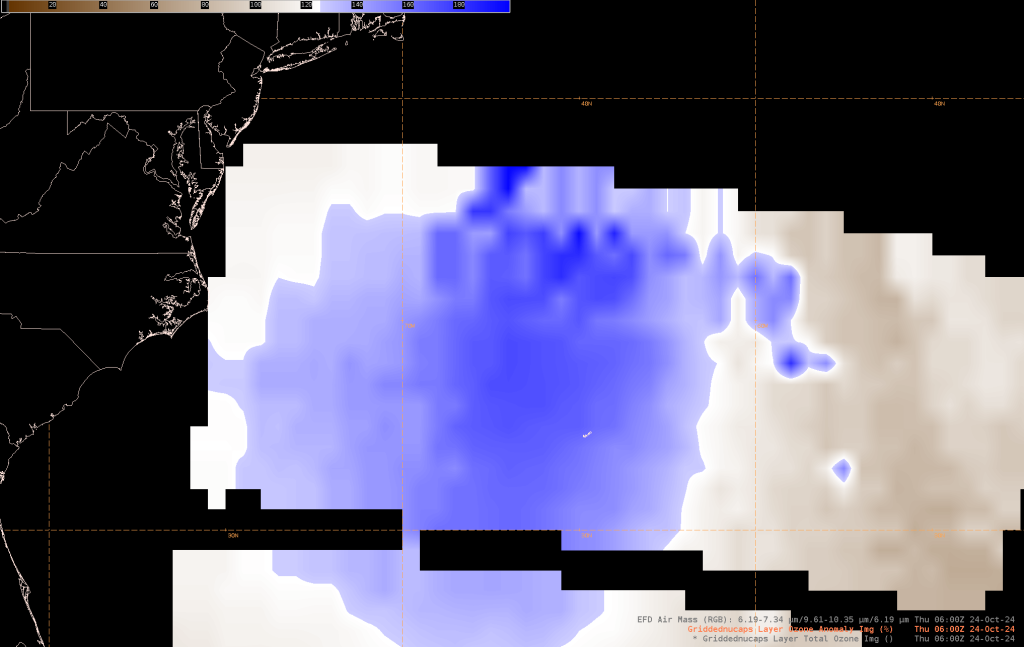
Figure 3: Gridded Nucaps Ozone Anomaly Percentage valid 0600 UTC 24 October 2024. This image was exported from AWIPS.

The North Atlantic 48-hour Wind and Wave Forecast issued at 1803 UT 22 October 2024 forecasted significant wave heights up to 7 meters associated with the storm-force low at 1200 UTC 24 October 2024. Well enough, at 1030 UTC 24 October 2024, the Cryosat-2/SIRAL altimeter overpass observed significant wave heights approaching 20 feet.
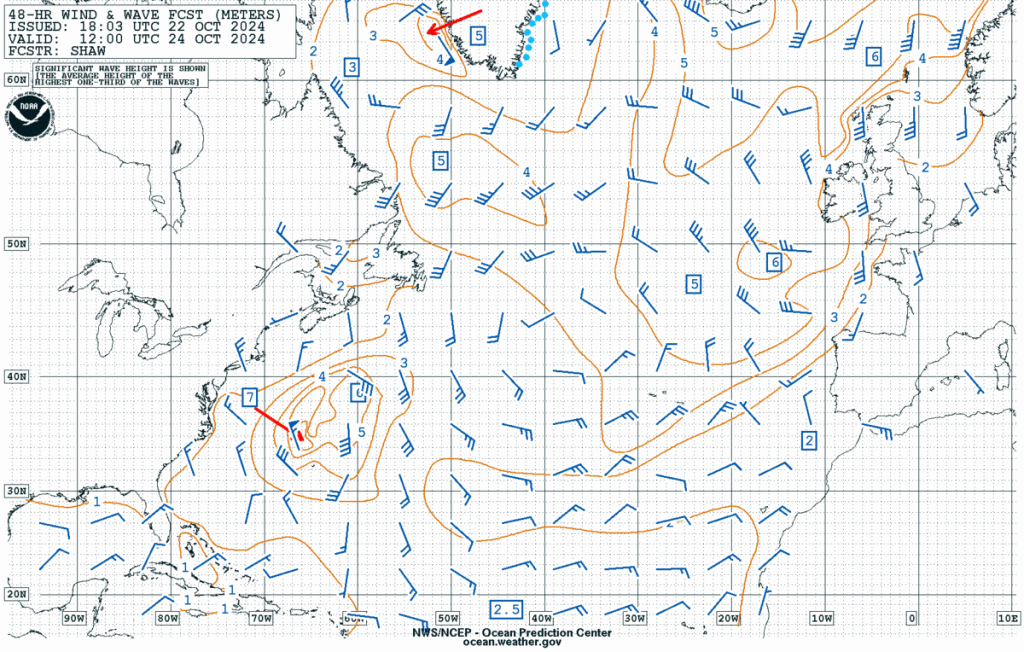
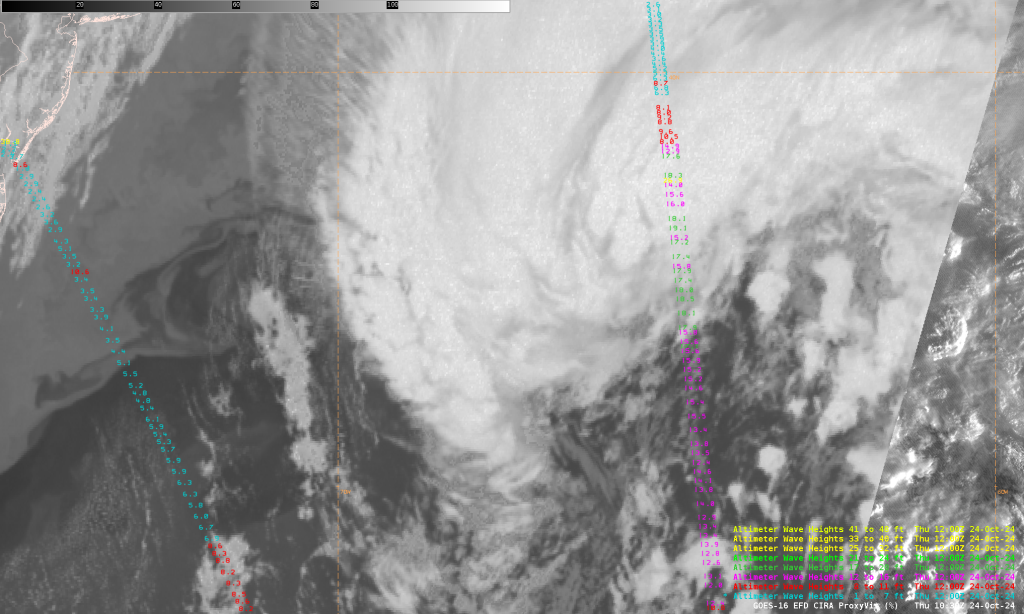
Figure 4: North Atlantic 48-hr Wind & Wave Forecast valid 1200 UTC 24 October 2024.
Figure 5: Cryosat-2/SIRAL significant wave heights approach 20 feet to the north of the extratropical cyclone circulation at 1030 UTC 24 October 2024. This image was exported from AWIPS.

The altimeter also provided an estimation of the wind speed, signaling winds had been storm-force, at 55 kts. Although altimeters can struggle with high wind speeds due to being a nadir radar, the observations are still very helpful to forecasters in the data sparse oceans.
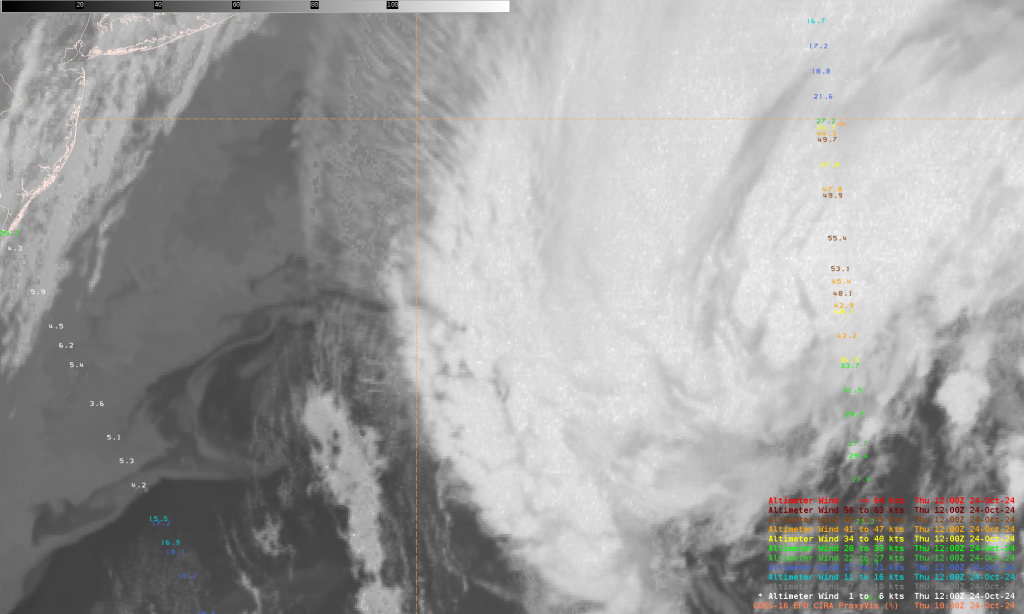
Figure 6: Cryosat-2/SIRAL wind speed observations valid 1030 UTC 24 October 2024. This image was exported from AWIPS.

As the sun rose on the extratropical cyclone, it became easier to see the dual circulations spinning with the GOES-East Full-Disk 10-minute Visible Band 2 imagery. The high, 0.5-km resolution of the visible imagery depcited impressive cloud tops along the cold front to the east of the cloud-free region as convection fired.
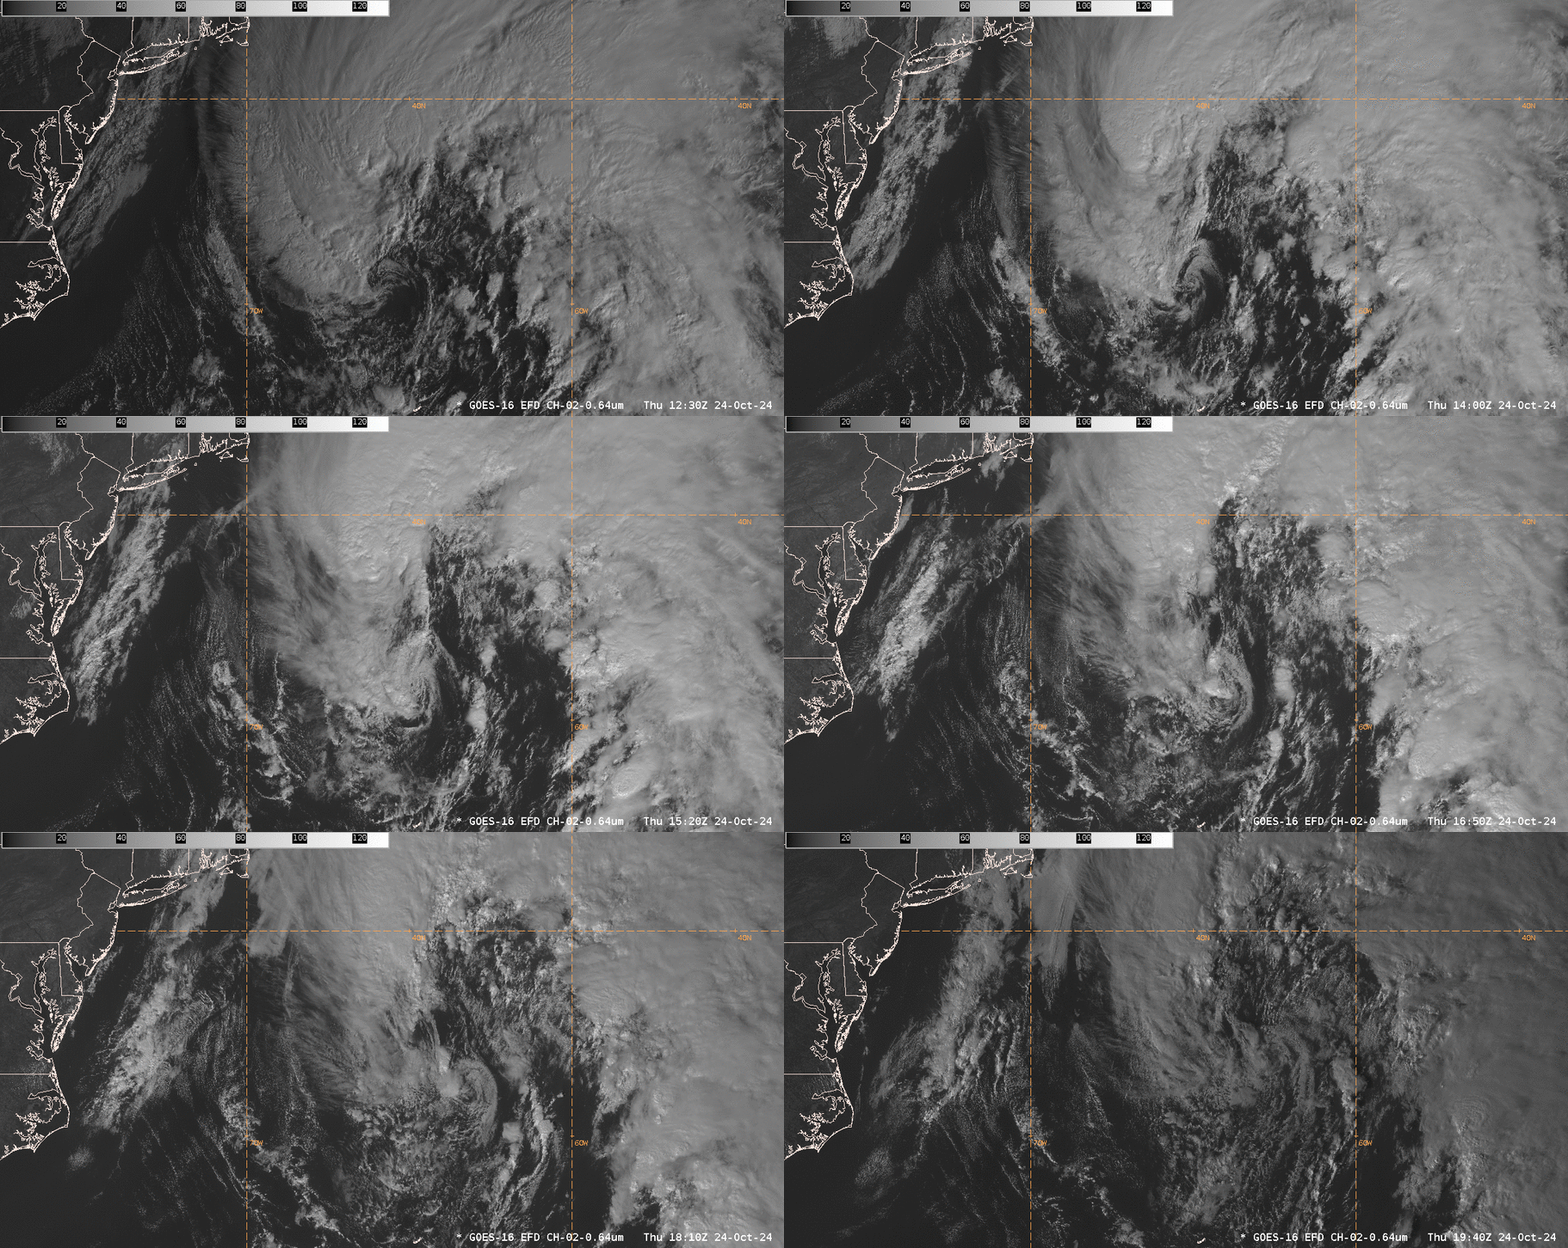
Figure 7: GOES-East Full Disk Visible Band 2 imagery valid ~1240 to ~1940 UTC 24 October 2024. This animation was created in AWIPS, and display files can be shared upon request.

At 1440 UTC 24 October 2024, a Metop-B/ASCAT pass confirmed the Cryosat-2 altimeter’s observation of storm-force winds, though with the area of highest winds located just west of the occluded front. Wind speeds in excess of 50 kts., or storm-force, were observed. The dual circulations in areas of light wind speeds can also be seen.
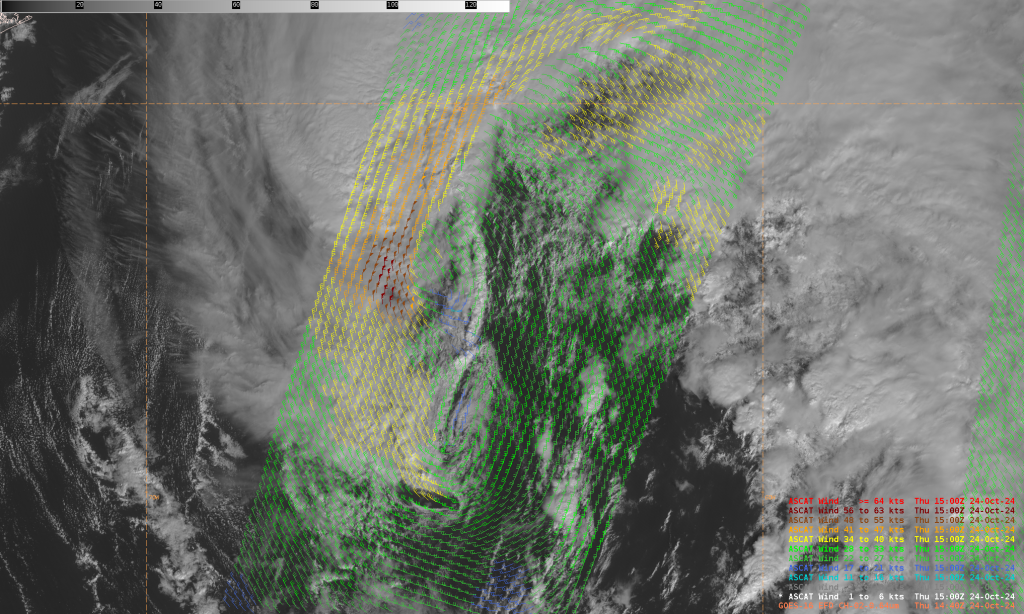
Figure 8: Metop-C ASCAT pass overlaid on GOES-East Visible Band 2 imagery valid 1440 UTC 24 October 2024. This image was exported from AWIPS.

GOES-East Full-Disk 10-minute GeoColor imagery overlaid with GLM Group Energy Density, a distance-weighted GLM ‘group’ energy over 10 minutes, captured the dynamic nature of the system, with ample lightning along the cold front, and even a few flashes along the warm and occluded bent-back fronts.
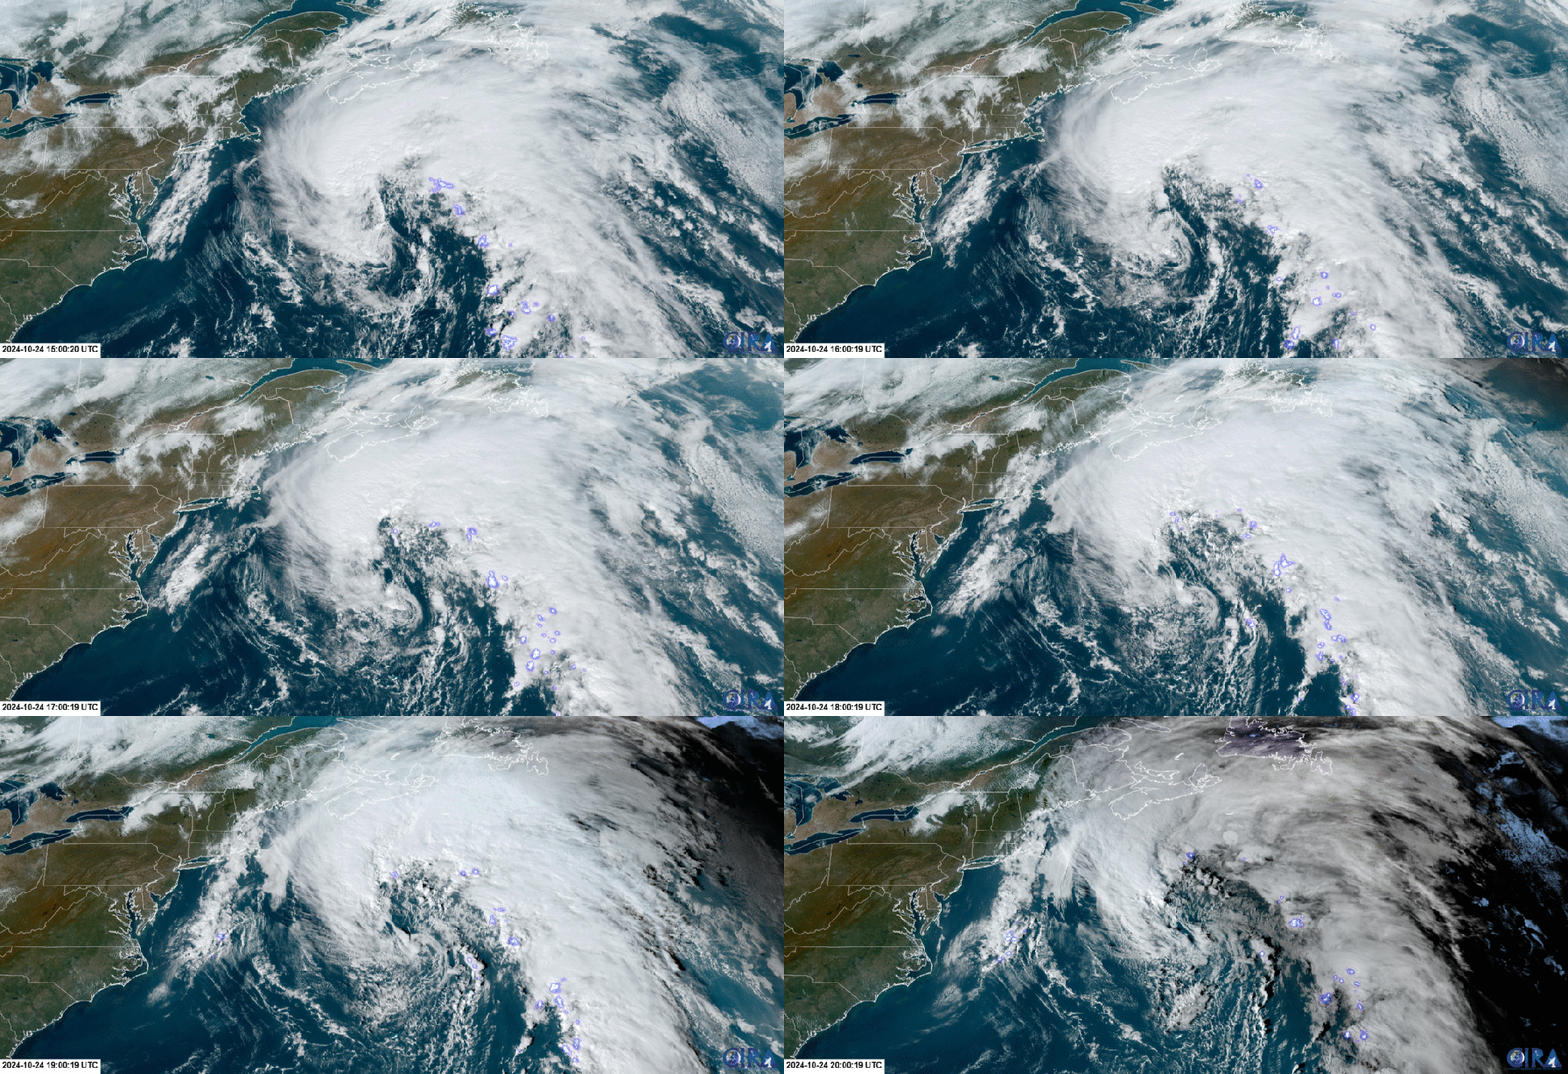
Figure 9: GOES-East Full Disk GeoColor imagery overlaid with GLM Group Energy Density from ~1520 UTC to ~2000 UTC 24 October 2024. From CIRA Slider
Picture of Christopher Smith

Christopher Smith

Christopher Smith joined ESSIC/CISESS, University of Maryland in 2023 and is the GOES-R Satellite Liaison for the NWS Weather and Ocean Prediction Centers. Smith works to interpret experimental satellite imagery and products, and make such products available to forecasters and the NWS for a route to operations. He trains forecasters how to use satellite imagery in weather forecasting, while also delivering forecaster feedback to satellite developers to maximize meteorological satellite capabilities. Smith is an alumni of the UMD Atmospheric & Oceanic Science (AOSC) Department, and his long-term interests include infusing AI-Satellite Products to increase lead time in decision making for forecasters.

Previous Entries