Mapping the Extent of the Devastating July 4 Texas Flash Flood Event

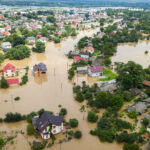
The July 2025 flood event in Texas Hill Country, fueled by remnants of Tropical Storm Barry, resulted in, to date, 135 fatalities, including 28 children at riverside camps, the deadliest U.S. inland flood since 1976. 


The Flash Flood Alley’s landscape features narrow valleys with thin, clay-rich soils overlying fractured limestone bedrock. This geology forces >70% of rainfall to become surface runoff (minimal infiltration). Valleys like the Guadalupe River basin constrict floodwaters and accelerate flow velocities. Even moderate rain can trigger rapid rises. Two hundred and fifty-four mm of rainfall fell in three hours, midnight July 3–4 at Hunt (500% of the July average), exceeding a 1,000-year recurrence interval. On 4 July, the Guadalupe River rose 8 m in 45 minutes, overwhelming Camp Mystic (152 m from the channel). The unique atmospheric-topographic nexus enabled rapid runoff amplification. It was cloudy on 4 July, and the Visible Infrared Imaging Radiometer Suite (VIIRS) daily 375-m floodwater product was unable to provide usable flood inundation information. 


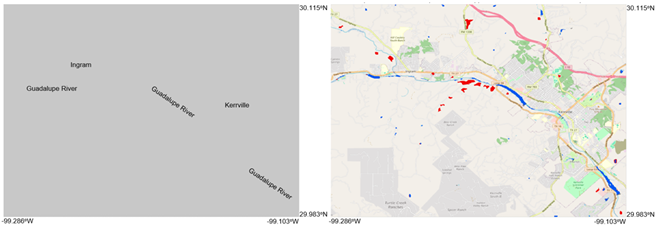
ESSIC/CISESS Scientist Qingyuan Zhang and the NOAA STAR Flood team have been working to order synthetic aperture radar (SAR) images and produce SAR flood inundation products. One Sentinel-1 image on 4 July was acquired and processed, and the NOAA STAR Flood team produced a SAR flood inundation map based on this image (see figure). The 4 July SAR map captured some flood inundated areas. All flood products are delivered to the RealEarth platform at the Space Science and Engineering Center at the University of Wisconsin-Madison for public use.

Figure. Two images showing the same geographical area. (Left) VIIRS 375-m daily floodwater extent product on 4 July 2025, with the locations of the Guadalupe River and the towns of Ingram and Kerrville superimposed. Cloudy conditions were in place so no flood inundation information was available, hence the gray background. (Right) The SAR flood inundation map on 4 July 2025, showing some flooded areas (in red).

This article was put together based on scientist input.