")
As the climate warms, wildfires are becoming more severe and unpredictable. Shifts in wind, weather, and fuel conditions can cause fires to change direction or intensity in an instant. Most emergency fire trackers rely on operational data, such as specialized aircraft flights that map the fire’s perimeter. However, because of resource constraints, bad weather, or other challenges, some fires are never mapped by fire response agencies. In those cases, scientists turn to satellites as their only source of data.
University of Maryland researcher Tempest McCabe is developing new tools to use satellite data to monitor and analyze fires in near-real time. The Wildfire Tracking Lab provides twice-daily estimates of every fire larger than four square kilometers in the U.S. and Canada, using satellite data to ensure consistent coverage. The result is not only a record of where a fire is at a given moment, but a timeline of its growth and evolution over days or weeks.
“By estimating fires every 12 hours we construct a timeline of the fire’s evolution. This is useful for communicators, and people who are trying to use the full history of a fire to understand what it will do next,” said McCabe, Post-Doctoral Associate at Earth System Science Interdisciplinary Center (ESSIC) and NASA Goddard Space Flight Center.
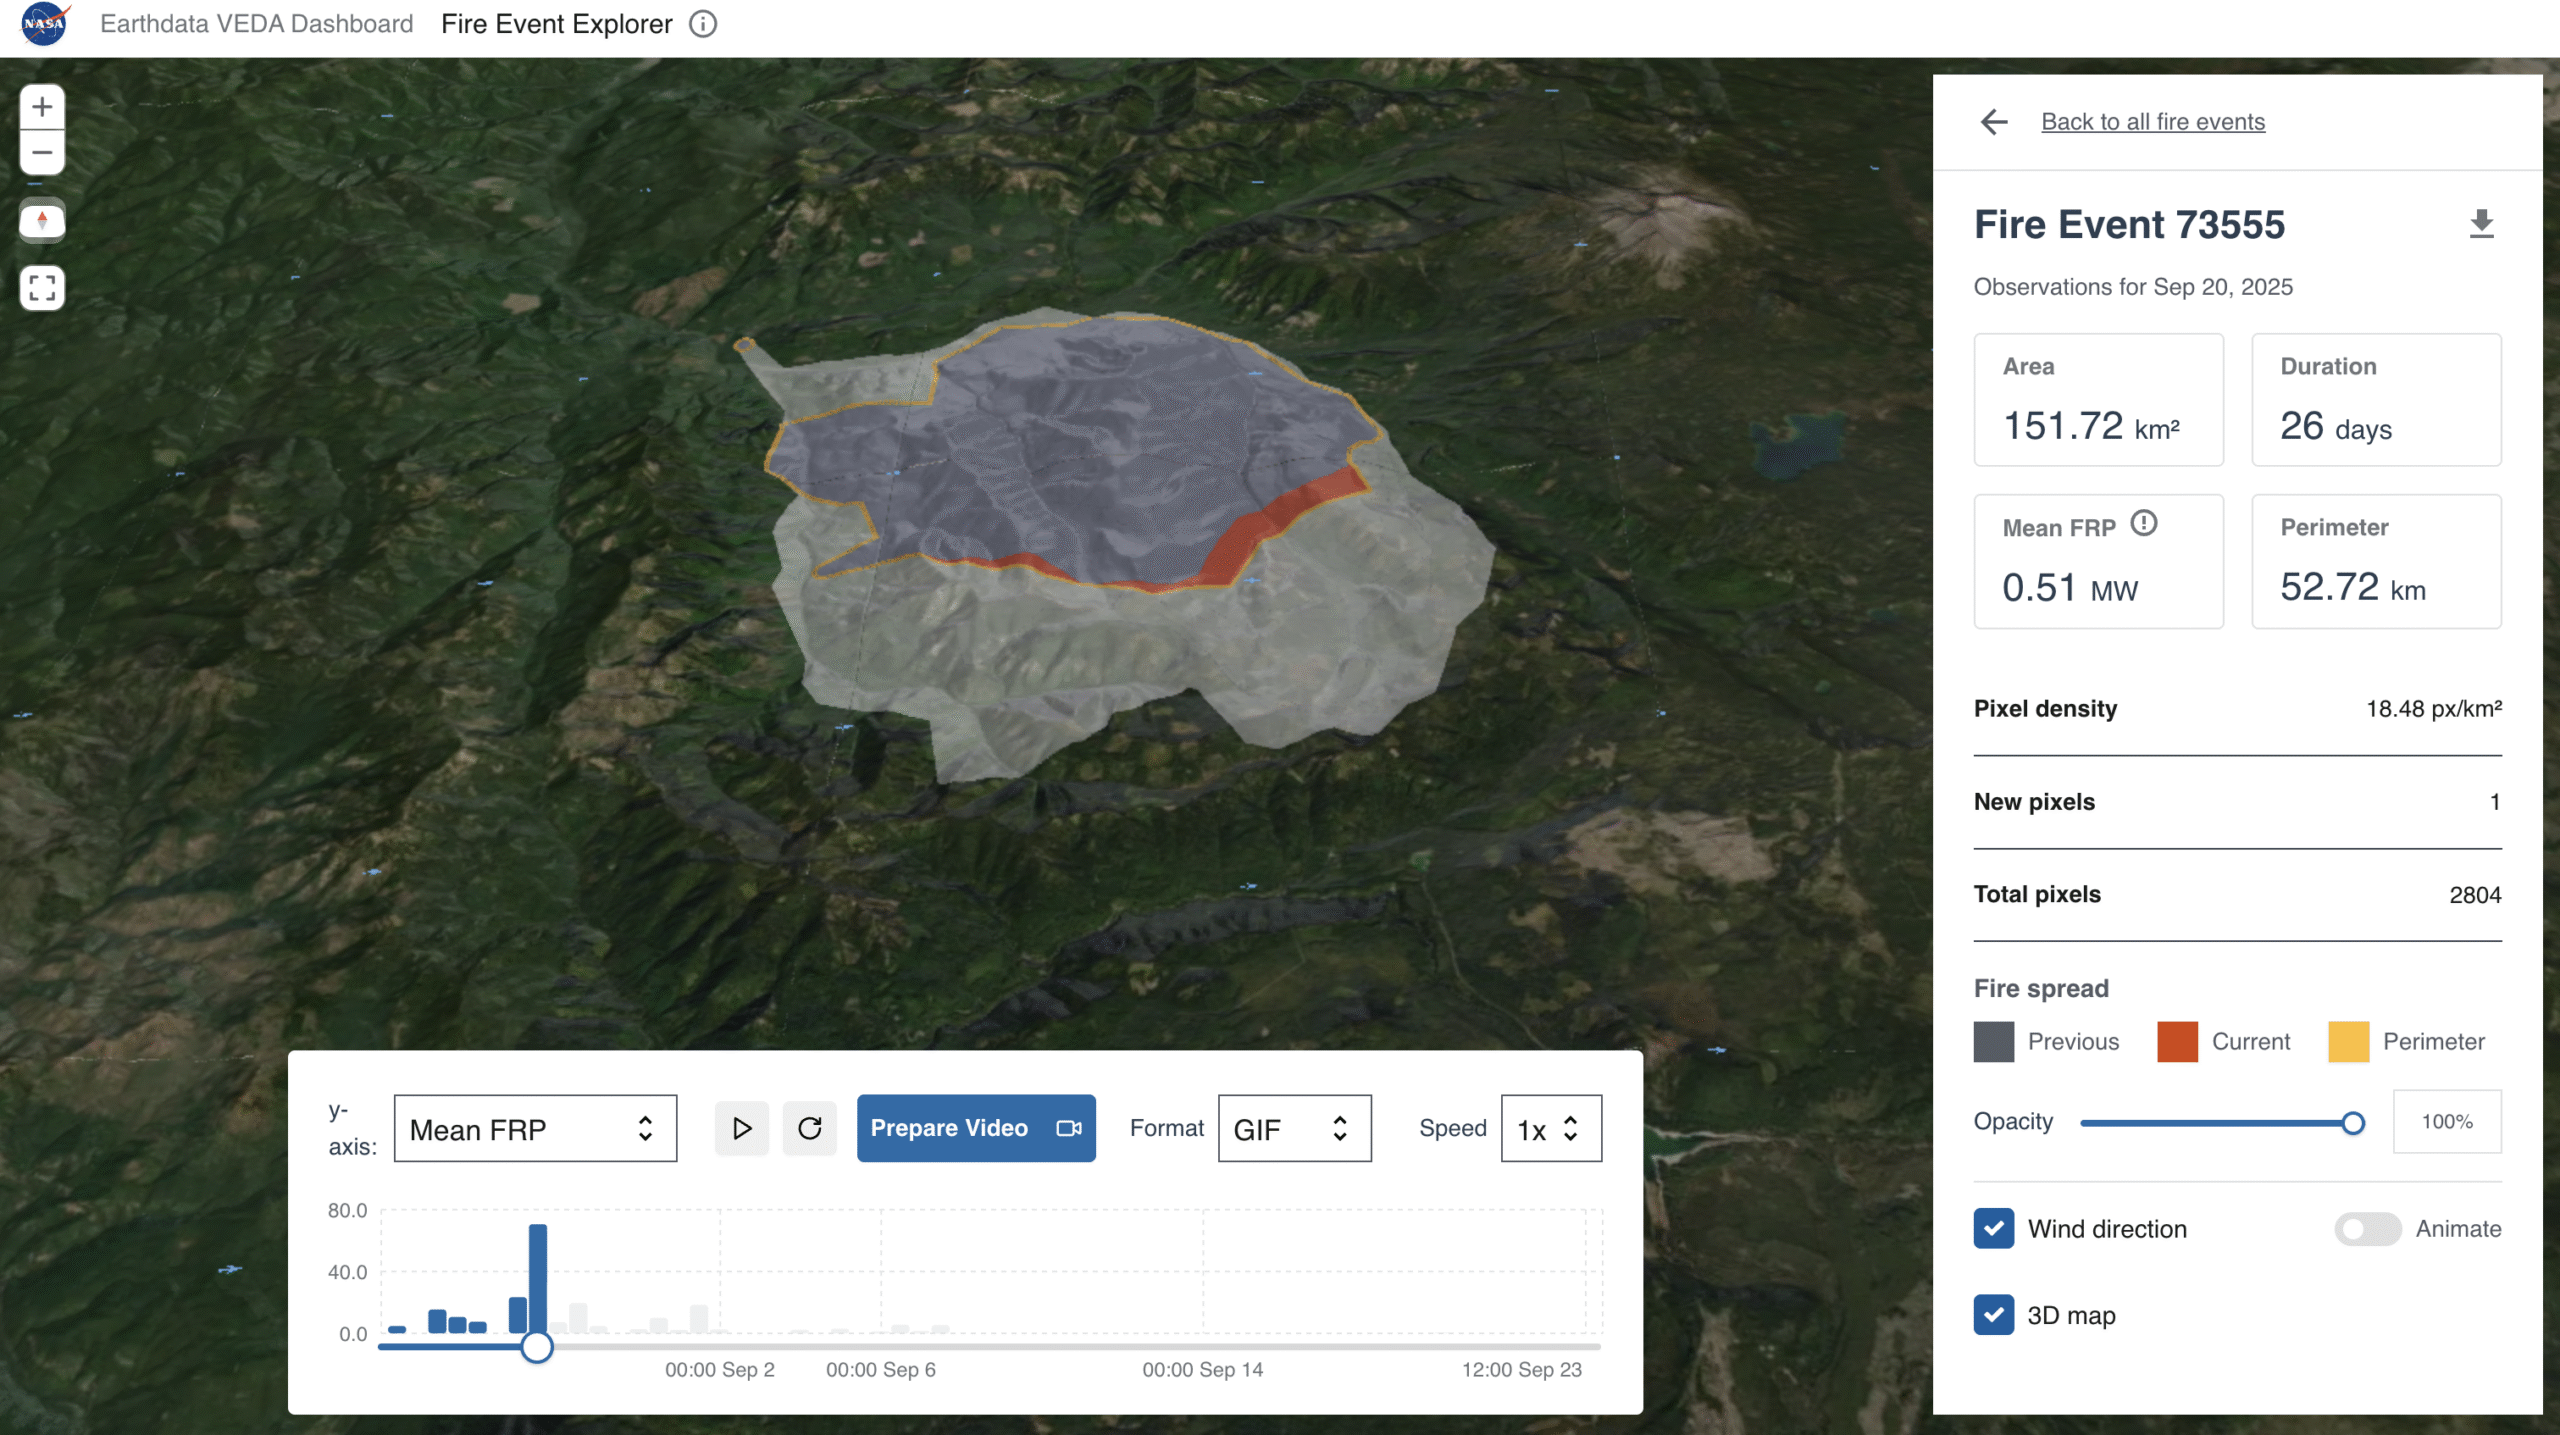
Recently, the team collaborated with NASA’s Visualization, Exploration, and Data Analysis (VEDA) to create the Fire Event Explorer, an interactive tool that lets users visualize and animate the growth of individual fires without any programming experience. With these layers, users can view active fire perimeters from the beginning of the calendar year up to the present day, as well as save an animation showing a fire’s growth over time.
The above figure depicts the Emigrant fire, currently burning in Oregon’s Willamette National Forest. The Fire Event Explorer captures some of the key moments of the fire’s progression, such as August 28, when the satellite detected the most active burning. At that time, the “Mean FRP” (mean Fire Radiative Power) bar graph at the bottom of Figure 2 shows both nighttime and afternoon values at unusually high levels. This coincided with the fire burning rapidly upslope and overtopping McGowan Mountain. Fires often move faster and burn more intensely when climbing steep terrain.
This data has many research applications in fire modeling, smoke modeling, and better understanding emissions from fires. Elijah Orland, another member of the Wildfire Tracking Lab, uses the data to predict where in a fire’s footprint has the most severe burning, which can be useful for developing early interventional strategies to mitigate the risk of subsequent flooding and debris flows.
One of the most useful applications of the data has been for communicators and environmental decision makers. The team’s data is used by the Earth Information Center (EIC) as part of their daily visualizations of wildfires.
“When wildfires hit, it can take time to assemble datasets and make high quality visualizations. Our data on EIC, and through tools like the Fire Event Explorer, help provide the publisher with critical context around wildfires as fast as possible,” said McCabe.
To further bring their work to stakeholders, the team has also made the Lab’s fire tracking services available as Esri-based Map Image Layers through NASA Earthdata. Stakeholders can access three layers of information: the Fire Perimeters layer, which shows the estimated area affected by a fire; the Active Fire Front layer, which highlights the perimeter of active burning; and the Fire Detections layer, which displays the individual satellite pixel detections that indicate fire activity. This makes it easier for stakeholders in the GIS community and the NASA Disasters program to integrate the data directly into their workflows.
McCabe sees this data as an important way to document — and learn from — emerging extremes in fire behavior. As fire seasons grow longer, blazes become larger, and weather patterns more extreme, this research offers critical insight into how fires are changing in a warming world.
The datasets and tools are publicly available on the Wildfire Tracking Lab website. The Wildfire Tracking Lab welcomes collaboration, feedback, and examples from anyone putting them to use.