Headlines
- El Nino rainfall anomaly pattern remains dominant in tropics as El Nino intensifies
- Tropical cyclones very active in both western and eastern Pacific with little such activity in the Atlantic
- Heavy monsoon rain over northern India and Nepal set the stage for catastrophic glacier collapse, flood and debris flow killing hundreds.
- El Nino increases global total precipitation and magnitude of land/ocean difference.
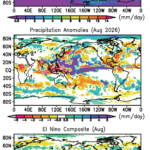
The ongoing El Niño keeps intensifying with rapidly warming SSTs in the central and eastern Pacific and now decreasing SSTs in the western Pacific and surrounding the Maritime Continent. The RNino3.4 was +1.8C at the end of August, almost a 0.5C increase from the month before. The combination of seasonal variation (August), the El Nino, and global warming has made this August the hottest August on record according to NOAA/NCEI. The U.S. itself had the hottest summer on record. As far as precipitation, Fig. 1 (top panel) shows a very intense ITCZ in the eastern Pacific, but a distinct lack of rain from Java through New Guinea. From the tropical Pacific a strong band of rain extends northwestward toward Taiwan and mainland China, containing the tracks of multiple tropical cyclones during a very active month there. Another rainfall maximum is located in northern India and Nepal extending southeastward through Indochina.
The rainfall anomaly map for this August (Fig.1, middle panel) has a very strong negative feature stretching from southern India through Sumatra and New Guinea. This is a key signature of the El Niño (see Fig. 1, bottom panel) and a big reversal from rainy La Nina conditions last year. Farther east the very warm SSTs produce the moisture, convection and positive rainfall anomaly stretching east just north of the Equator from the dateline to the coast of South America. Weaker positive anomaly features just to the north are mainly associated with tropical cyclones tracking to the northwest with heavy rainfall affecting Hawaii. These dry and wet features are generally evident in the August composite El Nino map (Fig. 1, bottom panel). As for last month the dry feature in northeast South America is distinct. The Atlantic ITCZ has a dry anomaly extending west of the African coast with a relative wet band just to the north indicating a northward shift of the ITCZ. This Atlantic ITCZ pattern is also evident in the El Nino composite for this month. The lack of tropical cyclones in the Atlantic is nearing a record for up to this time of the season. Central America and Mexico are also dry matching the composite.
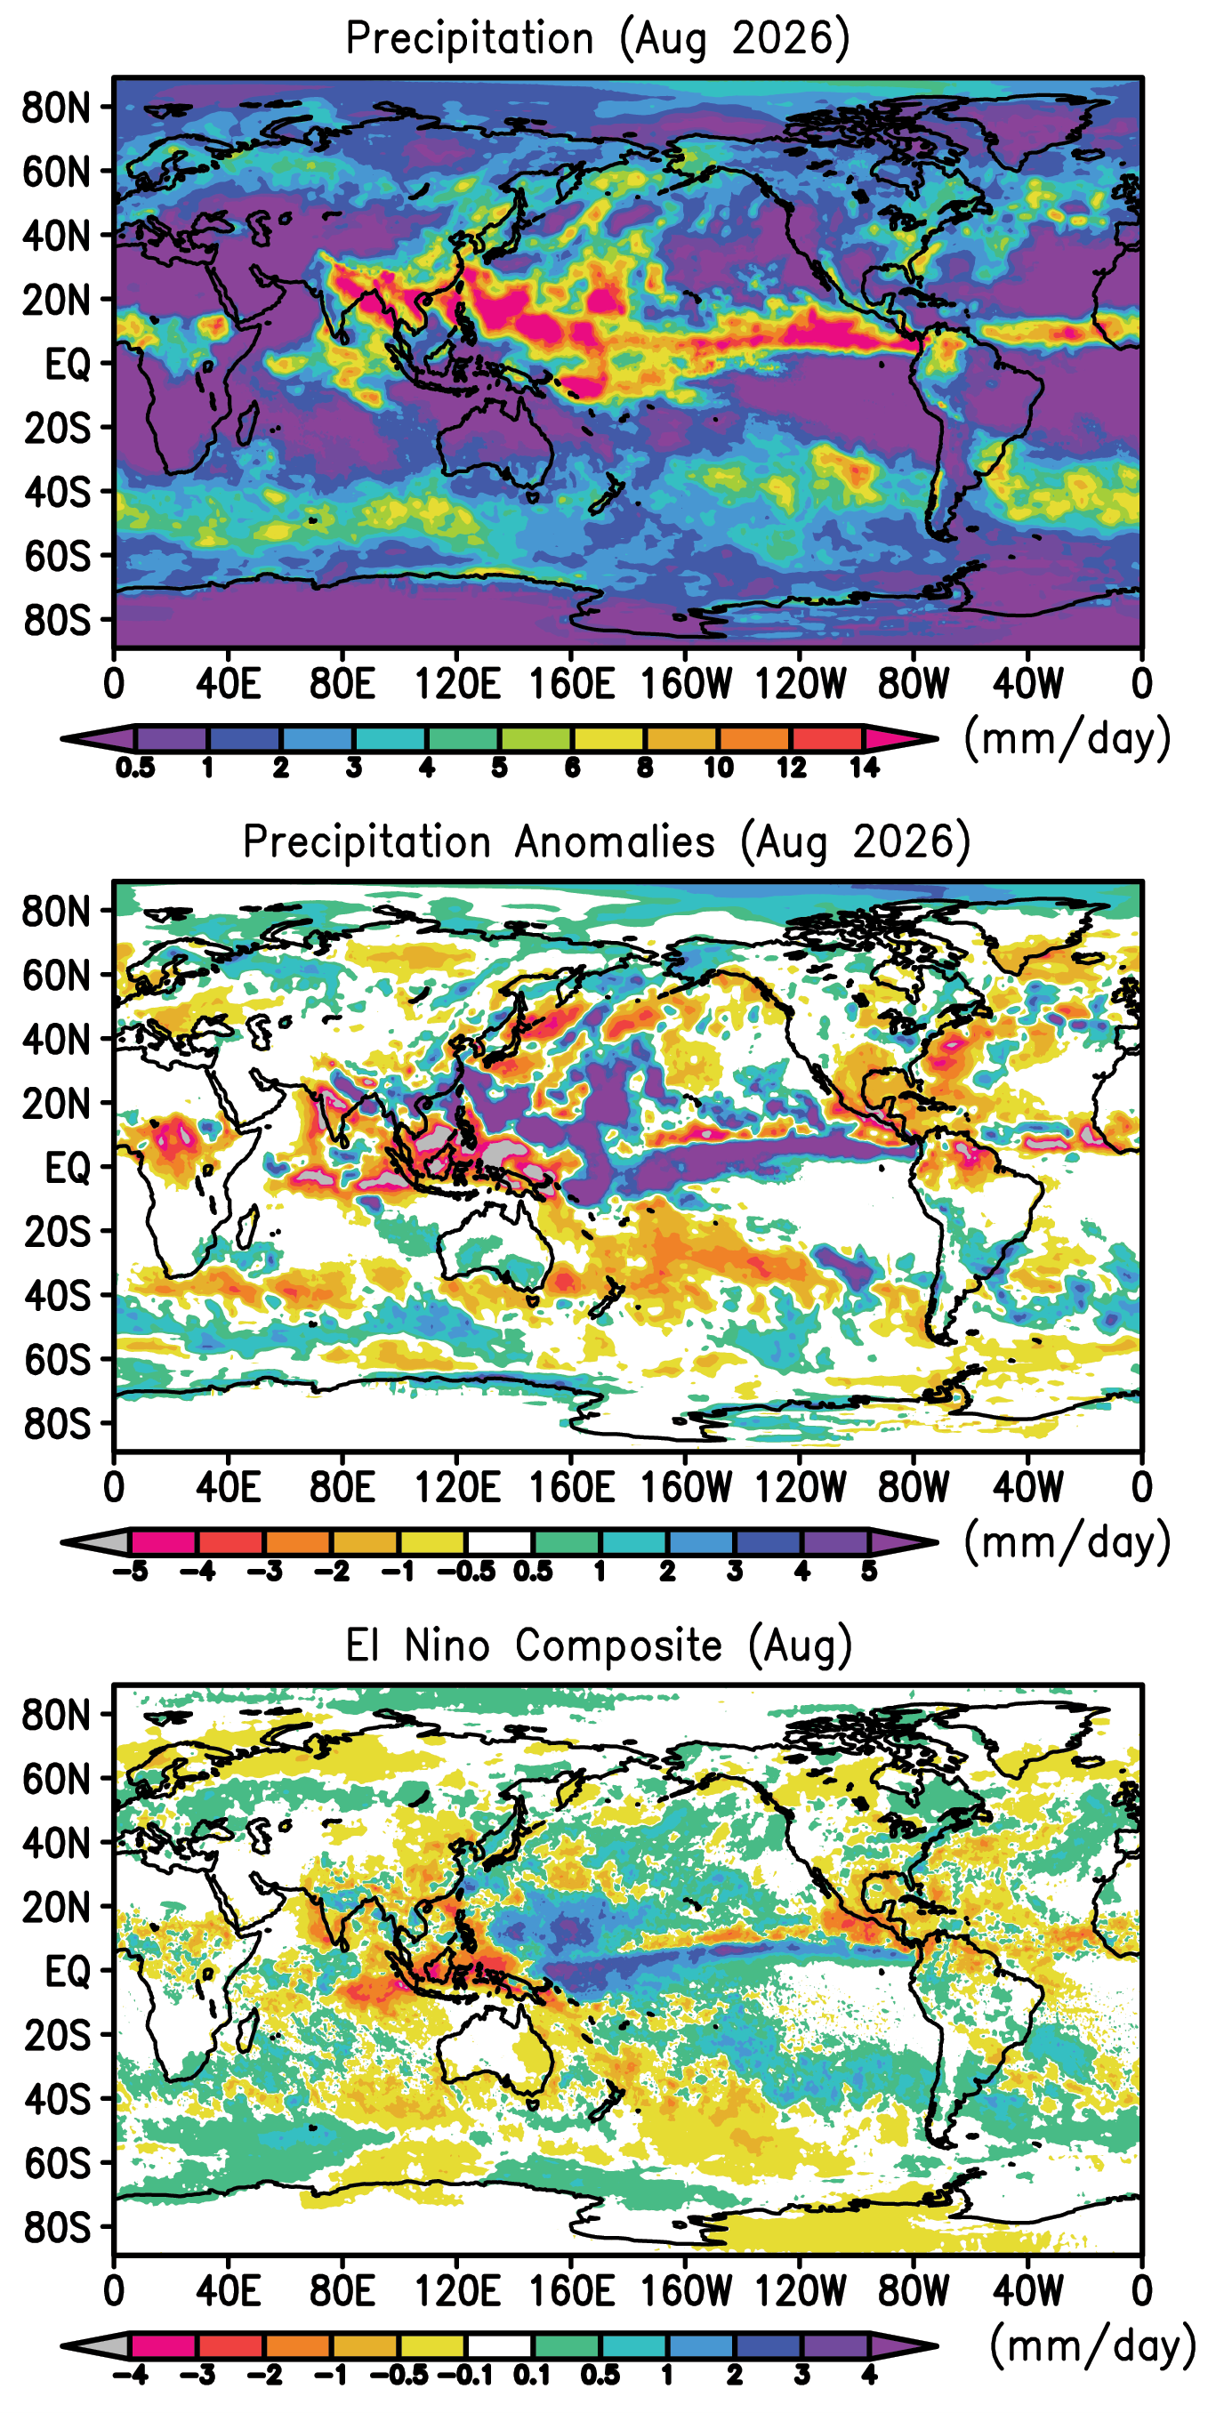
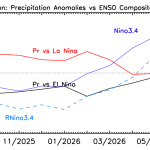
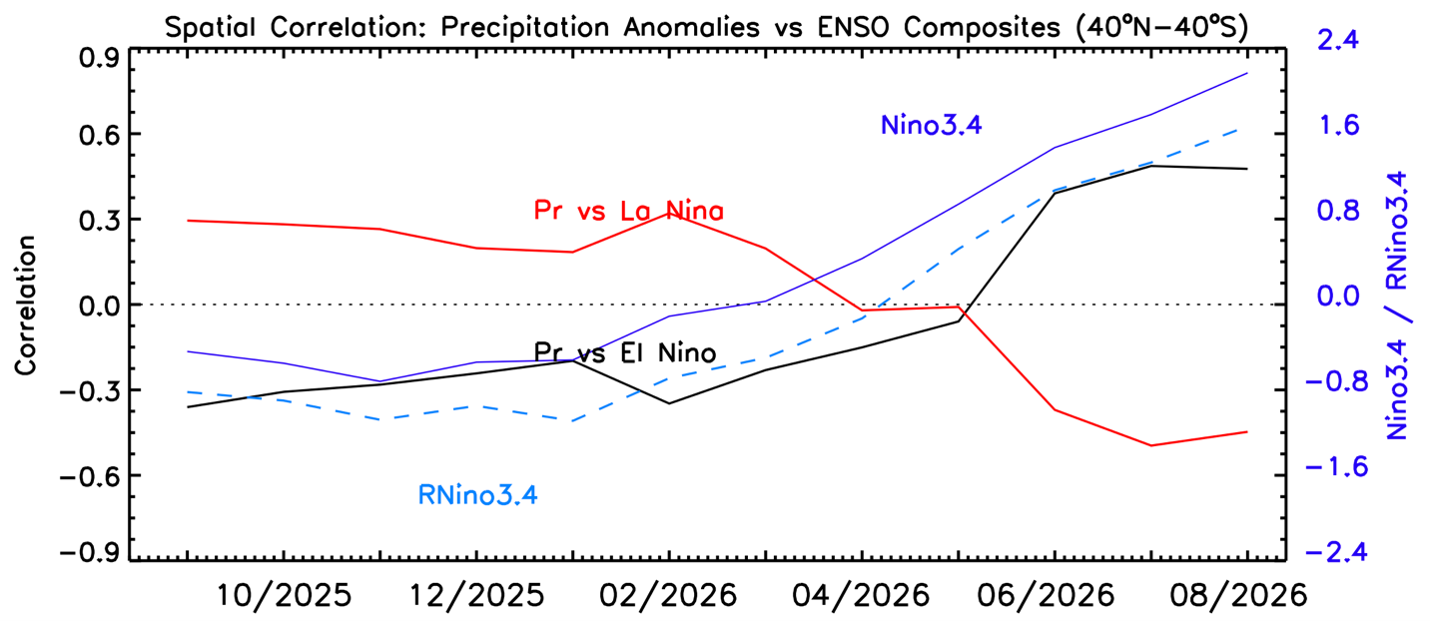
Figure 2 shows the time history of Nino3.4 Index with the sharp rise over the last months along with the jump at the beginning of NH summer of the spatial correlation of tropical rainfall anomaly pattern with the respective El Nino and La Nina composites. The correlation jumped up in June, but has remained near constant since then, but should increase again in the next few months as the El Nino impact spreads geographically east and west and into higher latitudes.
Elsewhere drought and wildfires occurred this August in North America in western Canada and Washington/Oregon and within the continuing drought and hot weather in Europe. The lack of rain in the Caribbean and surrounding waters has led to water shortages in Puerto Rico, exasperated by the El Nino.
While the south central U.S. has been dry, the upper Midwest in August, along with the Northeast has seen significant convection and rain, including flooding in Indiana and severe thunderstorms all the way to the east coast. The southwest U.S. has had some summer relief from monsoon-based convection with some heavy rain events, including a deadly flash flood at the bottom of the Grand Canyon at the end of the month.
In Nepal, along the border with China, heavy rains this summer probably helped set the preconditions for the catastrophic flash flood and debris flow with hundreds of deaths caused by a glacier collapse.
Table 1 Global precipitation and anomalies in August 2026.
| Mean Precipitation (August 1983-2025) | Precipitation (August 2026) | Precipitation anomaly (August 2026) |
Land+ocean | 2.83 | 2.88 | +0.05 |
Land | 2.44 | 2.22 | -0.23 |
Ocean | 3.00 | 3.16 | +0.17 |
The land/ocean distribution of precipitation, along with the global total continues to show El Nino characteristics with the land in deficit and the ocean higher than climatology (with bigger differences than last month) along with the global total (land + ocean) having a positive anomaly.
Figure 3 shows the global total precipitation anomaly and surface temperature anomaly since 1983 with El Nino’s appearing in general above the mean in global precipitation and above the trend line for the global surface temperature. However, during the 2025 La Nina the global total precipitation fell below the long term mean, as usual in La Nina conditions, but the global surface temperature anomaly remained above the trend line, unusual in terms of most La Nina periods.
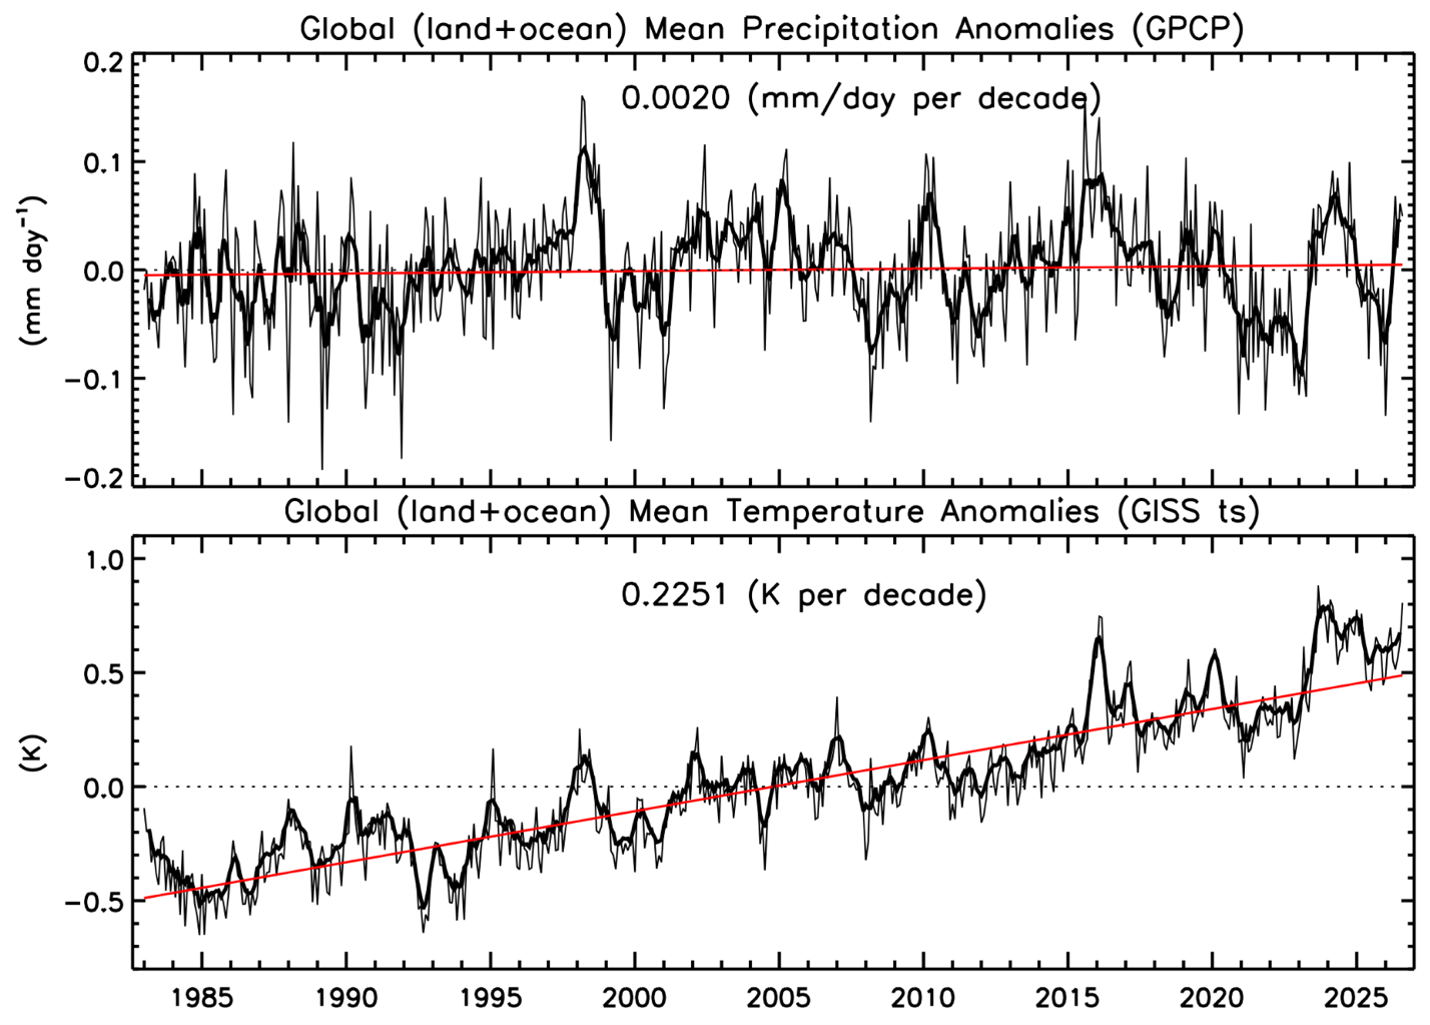
But as we have moved into this year’s El Nino the total precipitation has jumped up above the mean from the negative anomaly values during the last year’s La Nina. But the surface temperature had remained high (above the trend line) during the La Nina. The August 2026 Ts value has jumped up (thin line on the right end of the bottom panel in Fig. 3) and probably indicates even higher global temperatures to come in the next months and year.
BACKGROUND
The Global Precipitation Climatology Project (GPCP)
This global precipitation summary is based on V3.2 of the Monthly Global Precipitation Climatology Project (GPCP) product, an observation based analysis using satellite observations over oceans and satellite and rain gauge observations over land. The Monthly analysis extends from 1983 to the near present as a Climate Data Record (CDR) with an extension to the previous month (within ~ 12 days of the end of the month) as an Interim CDR, or ICDR.
The development of the GPCP CDR products (Monthly and finer time scales) is supported by NASA’s MEaSUREs program. The GPCP Monthly ICDR was developed and its routine calculation is supported by NOAA’s National Center for Environmental Information (NCEI). GPCP products are available at NASA’s Goddard Earth Sciences Data and Information Services Center (GES DISC) and from NOAA NCEI as well as ECMWF’s Climate Store.
The following references describe GPCP products in detail and provide additional research results using GPCP by the authors of this summary:
GPCP V3.2 paper:
Huffman, G. J. and R. Adler, A. Behrangi, D. Bolvin, E. Nelkin, G.Gu and M. Ehsani, 2023. The New Version 3.2 Global Precipitation Climatology Project (GPCP) Monthly and Daily Precipitation Products. J. Climate, 36, 7635- 7655. DOI: 10.1175/JCLI-D-23-0123.1.
GPCP V2.3 paper:
Adler, R., M. Sapiano, G. Huffman, J. Wang, G. Gu, D. Bolvin, L. Chiu, U. Schneider, A. Becker, E. Nelkin, P. Xie, R. Ferraro, D. Shin, 2018. The Global Precipitation Climatology Project (GPCP) Monthly Analysis (New Version 2.3) and a Review of 2017 Global Precipitation. Atmosphere. 9(4), 138; doi:10.3390/atmos9040138
Other references:Adler, R., G. Gu, M. Sapiano, J. Wang, G. Huffman 2017. Global Precipitation: Means, Variations and Trends During the Satellite Era (1979-2014). Surveys in Geophysics 38: 679-699, doi:10.1007/s10712-017-9416-4 Adler, R. F., G. Gu, G. J. Huffman, R. P. Sapiano and J. Wang, 2020: GPCP and the Global Characteristics of Precipitation. In Satellite Precipitation Measurement, Vol. 2, Chapter 35, 677-697. Advances in Global Change Research, 69, Springer Nature, doi:10.1007/978-3-030-35798-6_11.
Gu, G., and R. Adler, 2023. Observed Variability and Trends in Global Precipitation During 1979-2020. Climate Dynamics, 61, 131-150.
Adler, R. and G. Gu, 2024. Global Precipitation for the Year 2023 and How It Relates to Longer Term Variations and Trends. Atmosphere, 15(5). 10.3390/atmos15050535.
Gu, G. and R. Adler, 2024. Variability and Trends in Tropical Precipitation Intensity in Observations and Climate Models. Climate Dynamics, https://doi.org/10.1007/s00382-024-07287-y.
The GPCP analyses are also used as part of the annual State of the Climate report published in the Bulletin of the AMS, in the Precipitation section ( Ziese, M., R. S. Vose, R. Adler, G. Gu and X. Yin, 2026. Precipitation. [in “State of the Climate in 2025”]. Bull. Amer. Meteor. Soc., 107 (8), S59–S60, https://doi.org/10.1175/BAMS-D-26-0141.1)