Headlines:
- El Nino-related rainfall anomalies dominate from the Indian Ocean to South America
- Global precipitation anomaly stays positive as El Nino intensifies
- Western U.S. remains dry with wildfires in the Four Corners (UT, CO, AZ, NM)
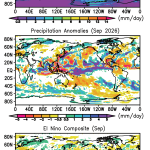
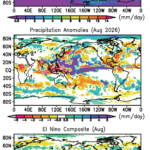
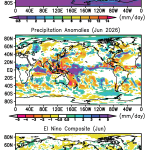
The El Nino is well underway with the RNino3.4 SST index at +1.2K at the end of June after a rapid increase from negative a few months ago. And the forecast remains for that index to go much higher and for this event to be very intense, and therefore have a significant impact on rainfall patterns across the globe. For June the ITCZ across the tropical Pacific has become intense (Fig. 1, top panel) with a large area of positive anomalies in the western Pacific with a narrow extension eastward to the South American coast (middle panel) as expected with El Nino conditions, even at this early stage. To the west there is a deficit of rain across a large zone from Indochina through the Maritime Continent and east of the Philippines.
To the north a very strong rainfall maximum runs from southern China through Japan and into the northwest Pacific. This feature is due to an active Meiyu/Baiu springtime front and early season tropical cyclone activity. To the west in the Indian Ocean a strong positive anomaly straddles the Equator.
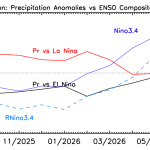
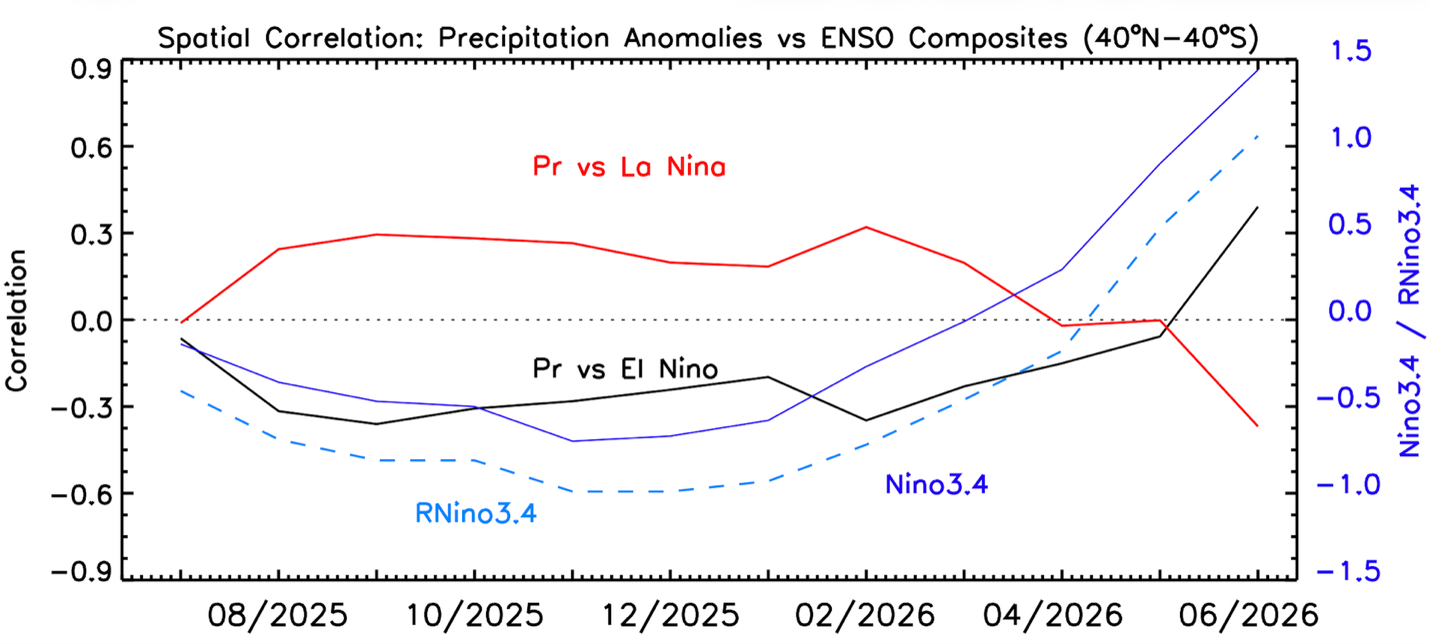
In the bottom panel of Fig. 1 is the El Nino anomaly composite for June. There is a fairly good correspondence between the two anomaly patterns (for this June and for the June composite) across the tropics from the Indian Ocean through northern South America. So, at least in much of the deep tropics, the expected El Nino rain pattern is evident even at this early stage of the event. The pattern correlation history (Fig. 2) shows a sharp rise in the connection to the El Nino anomaly pattern with a correlation for June of +0.4, increasing from near zero in May. Back in February the correlation to a La Nina pattern was also about +0.4, indicating the rapid shift from La Nina to El Nino rainfall patterns during the last four months.
Elsewhere western Europe from Spain into Russia was dry and very hot, with record-setting temperatures extending their drought. Scandinavia is relatively moist as is a mid-continent swath from the Caspian Sea to the Arctic Ocean. Dry conditions cover most of northern Asia.
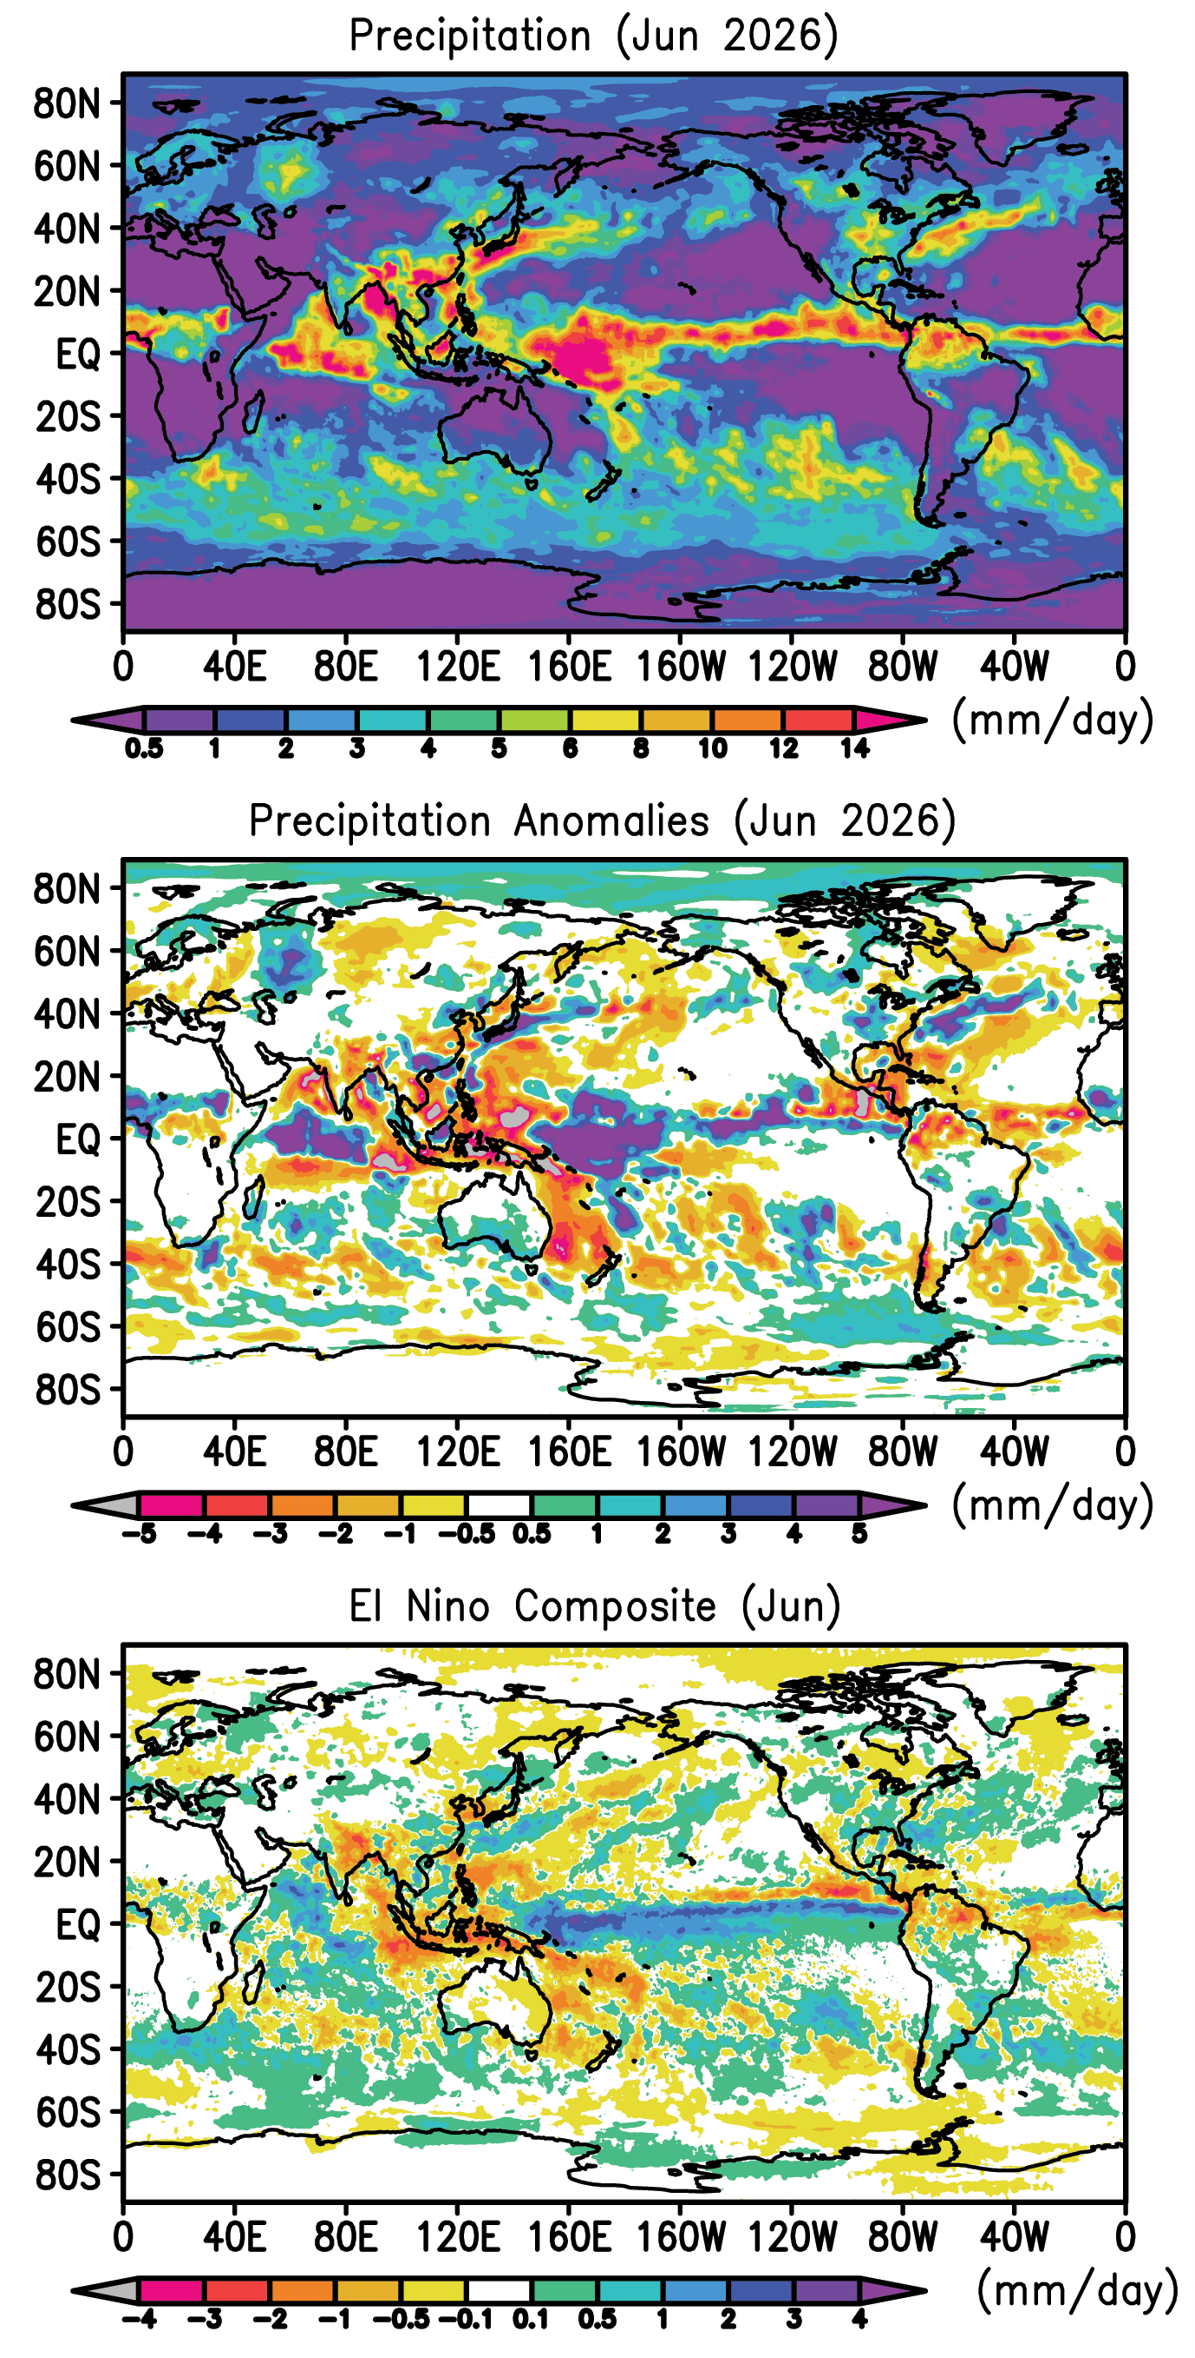
Africa has a mottled anomaly pattern in its tropical belt. South America has a rainfall deficit across its far northern tier, very similar to the El Nino composite.
Further to the north Mexico has mainly a positive anomaly and the U.S. has a strong positive anomaly from the Great Plains through much of the country’s mid-section with dry conditions along the east coast. In fact a weak tropical system, briefly TS Arthur, helped to flood San Antonio and then produced 4-8” of rain in Louisianna and Mississippi and more flooding. A major thunderstorm system also flooded Kentucky with some fatalities. But the western U.S. remained mainly dry with wildfires breaking out in all the four corner states, UT, CO, AZ and NM. This very dry region is looking forward to the North American Monsoon edging into the area, perhaps helped by the developing El Nino.
In terms of the total global precipitation, Table 1 indicates very small differences from the long-term means with both the land and ocean totals slightly above climatology. As the El Nino continues to develop we expect these numbers to show a larger ocean (land) positive (negative) anomaly with the overall global total with a positive anomaly.
Table 1 Global precipitation and anomalies in June 2026.
| Mean Precipitation (June 1983-2025) | Precipitation (June 2026) | Precipitation anomaly (June 2026) |
Land+ocean | 2.87 | 2.89 | +0.02 |
Land | 2.30 | 2.31 | +0.01 |
Ocean | 3.11 | 3.13 | +0.02 |
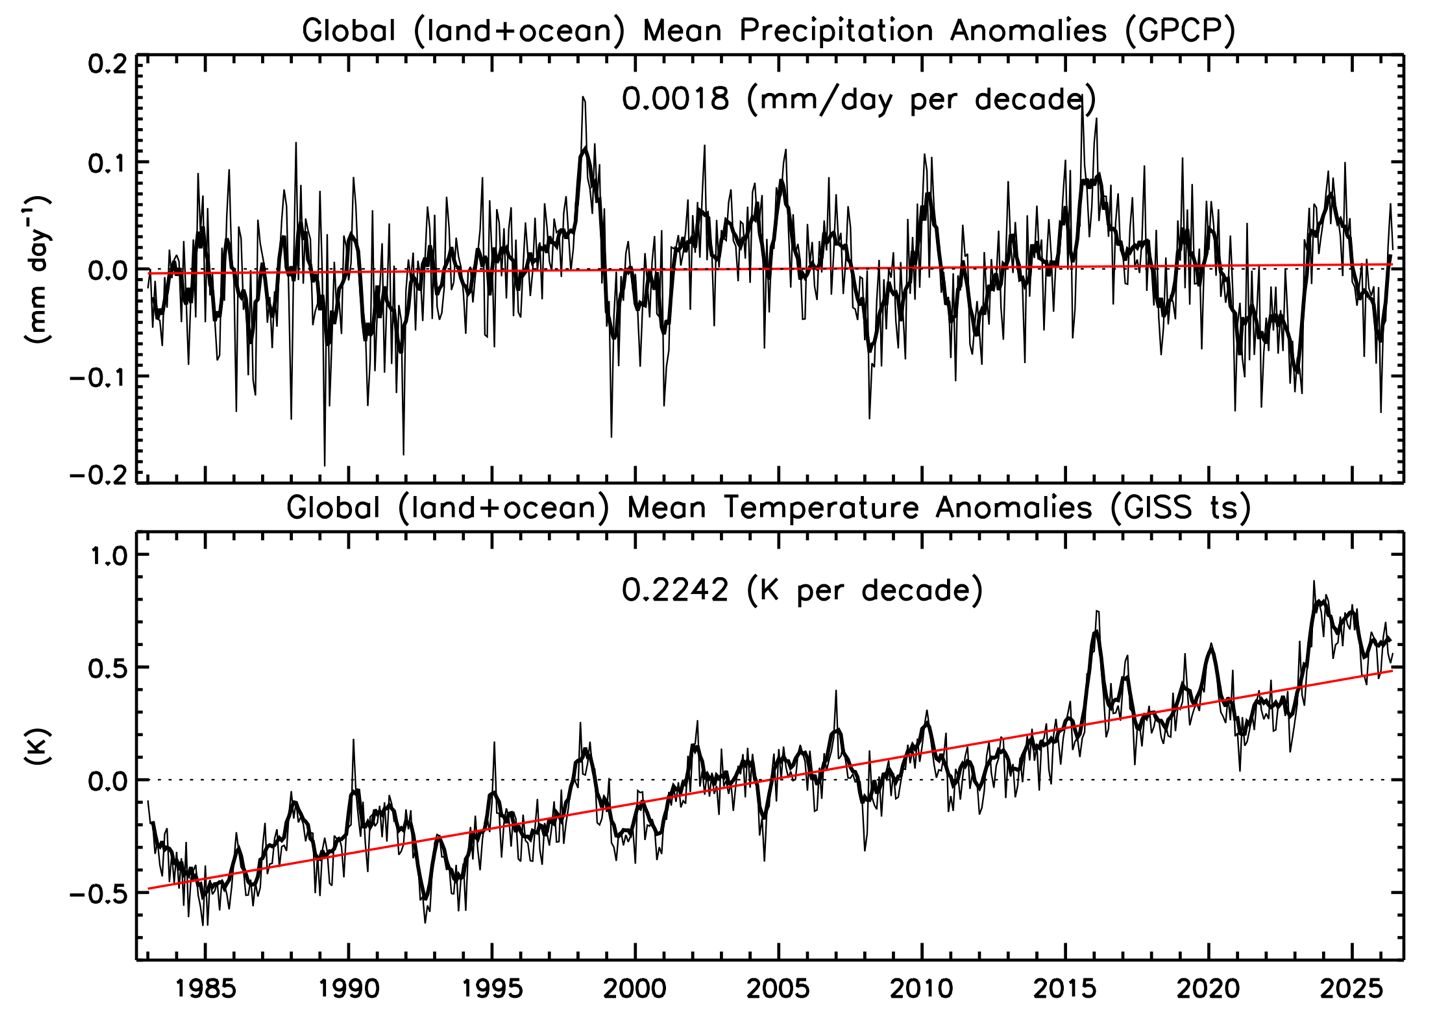
Figure 3 shows the global total precipitation anomaly and surface temperature anomaly since 1983. The last two months the total precipitation has popped up (slightly) above the mean from the lower values during the last year’s La Nina. The surface temperature had remained high during the La Nina, although dropping from the record highs during the 2024-2025 weak El Nino. However, the temperature stayed above the trend line even during the La Nina, unlike during most other La Ninas. With the new El Nino we expect the global Ts to increase and stay above that trend line. And the global precipitation numbers will increase and stay above their mean value line during this El Nino event.
BACKGROUND
The Global Precipitation Climatology Project (GPCP)
This global precipitation summary is based on V3.2 of the Monthly Global Precipitation Climatology Project (GPCP) product, an observation based analysis using satellite observations over oceans and satellite and rain gauge observations over land. The Monthly analysis extends from 1983 to the near present as a Climate Data Record (CDR) with an extension to the previous month (within ~ 12 days of the end of the month) as an Interim CDR, or ICDR.
The development of the GPCP CDR products (Monthly and finer time scales) is supported by NASA’s MEaSUREs program. The GPCP Monthly ICDR was developed and its routine calculation is supported by NOAA’s National Center for Environmental Information (NCEI). GPCP products are available at NASA’s Goddard Earth Sciences Data and Information Services Center (GES DISC) and from NOAA NCEI as well as ECMWF’s Climate Store.
The following references describe GPCP products in detail and provide additional research results using GPCP by the authors of this summary:
GPCP V3.2 paper:
Huffman, G. J. and R. Adler, A. Behrangi, D. Bolvin, E. Nelkin, G.Gu and M. Ehsani, 2023. The New Version 3.2 Global Precipitation Climatology Project (GPCP) Monthly and Daily Precipitation Products. J. Climate, 36, 7635- 7655. DOI: 10.1175/JCLI-D-23-0123.1.
GPCP V2.3 paper:
Adler, R., M. Sapiano, G. Huffman, J. Wang, G. Gu, D. Bolvin, L. Chiu, U. Schneider, A. Becker, E. Nelkin, P. Xie, R. Ferraro, D. Shin, 2018. The Global Precipitation Climatology Project (GPCP) Monthly Analysis (New Version 2.3) and a Review of 2017 Global Precipitation. Atmosphere. 9(4), 138; doi:10.3390/atmos9040138
Other references:
Adler, R., G. Gu, M. Sapiano, J. Wang, G. Huffman 2017. Global Precipitation: Means, Variations and Trends During the Satellite Era (1979-2014). Surveys in Geophysics 38: 679-699, doi:10.1007/s10712-017-9416-4
Adler, R. F., G. Gu, G. J. Huffman, R. P. Sapiano and J. Wang, 2020: GPCP and the Global Characteristics of Precipitation. In Satellite Precipitation Measurement, Vol. 2, Chapter 35, 677-697. Advances in Global Change Research, 69, Springer Nature, doi:10.1007/978-3-030-35798-6_11.
Gu, G., and R. Adler, 2023. Observed Variability and Trends in Global Precipitation During 1979-2020. Climate Dynamics, 61, 131-150.
Adler, R. and G. Gu, 2024. Global Precipitation for the Year 2023 and How It Relates to Longer Term Variations and Trends. Atmosphere, 15(5). 10.3390/atmos15050535.
Gu, G. and R. Adler, 2024. Variability and Trends in Tropical Precipitation Intensity in Observations and Climate Models. Climate Dynamics, https://doi.org/10.1007/s00382-024-07287-y.