University of Maryland

Global Precipitation Summary for May 2026

Headlines:   

  • Pacific rainfall anomaly pattern switching quickly toward El Nino
  • Global precipitation anomaly switches from negative to positive

Problems with one key input data set has delayed GPCP ICDR product generation for a couple of months, but things are at least temporarily back on track.  This report will focus on May, although the key plot for April will show up at the end of the report for completeness.

Sitting here in early/middle June the presence of an El Nino has been declared by NOAA based on the Nino 3.4 SST index.  Already in May there is a rapid change from a more La Nina pattern of anomalies to neutral with some key features more El Nino-like.  Figure 1 (top panel) shows a very strong ITCZ rain feature across almost the entire Pacific.  In the middle panel this ITCZ feature is a very strong positive anomaly.  This is the rainfall start of the El Nino! This feature is associated with the already rapidly warming Pacific SSTs, with the monthly RNino3.4 for May at +0.4 and increasing rapidly during the month. To the west, over the South China Sea a small region of negative anomaly is the presumed initial negative anomaly end to the usual positive/negative El Nino couplet. 


However, comparing to the El Nino composite for May in the bottom panel one can see that this May’s ocean ITCZ positive anomaly is a little north of the composite and the South China feature is tiny compared to the composite.  These differences are not surprising considering that the El Nino is just getting started. This is reflected in Fig. 2 showing the spatial correlation in the tropics between this May’s anomaly pattern and that of the El Nino and La Nina composites for May.  The correlation for both is essentially zero. i.e., neutral or in transition from weak La Nina towards El Nino.


Elsewhere the northern Indian Ocean is active, while the western portion is dry including the Horn of Africa, where crop yields are a hunger concern. While the coming El Nino should provide ample rain in this region (see El Nino composite), often in these situations there is a surplus of rain and flooding, also affecting crop yields.  Dryness continues over much of the U.S., especially the inter-mountain west, western Europe and the Amazon.


Table 1 gives the global totals for May and shows the jump up in the total over the ocean, probably due mainly to that strong Pacific ITCZ, with the global (land + ocean) total having a positive anomaly.  In Fig. 3 this sharp increase now puts the global precipitation anomaly in positive territory, along with the global surface temperature anomaly being above its trend line.  This often is typical of El Nino conditions, but during the last La Nina the precipitation anomaly was negative, but the surface temperature anomaly remained above the trend line.  This combination may be a harbinger of rapid temperature increase in the coming months and year.

Monthly precipitation anomalies in May 2026
Figure 1. Monthly precipitation and anomalies in May 2026 and El Nino composite for May.
Figure 2. Correlations between anomaly patterns of individual months (40oN-40oS) and El Nino and La Nina composites during June 2025-May 2026. Also shown are Nino 3.4 and Relative Oceanic Nino Index [RONI; monthly ERSST.v5 SST anomalies in the Niño 3.4 region (5°N–5°S, 120°–170°W) with average tropical mean (20°N–20°S) SST anomalies subtracted].

Table 1 Global precipitation and anomalies in May 2026.


Mean Precipitation

(May 1983-2025)

Precipitation

(May 2026)

Precipitation anomaly

(May 2026)

Land+ocean

2.80

2.86

+0.06

Land

2.08

2.08

-0.001

Ocean

3.10

3.19

+0.09


Monthly time series of GPCP global (land+ocean) precipitation anomalies
Figure 3. Monthly time series of GPCP global (land+ocean) precipitation anomalies (January 1983-May 2026) and GISS global mean temperature anomalies (January 1983-May 2026). 5-month-running-means are included in thick solid lines.
Figure 4. Monthly precipitation and anomalies in April 2026 and La Nina composite for April.

The figure above gives the results for April 2026, including the La Nina composite for April.  There is still a quasi-La Nina-look to the anomalies with deficits over parts of the middle Pacific and heavy rain and floods over Hawaii.  There were wildfires in southern California, Georgia and Florida.  Sixty-three percent of the U.S. was under drought conditions.

BACKGROUND

The Global Precipitation Climatology Project (GPCP)

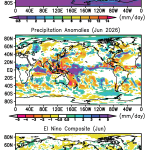
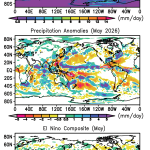
This global precipitation summary is based on V3.2 of the Monthly Global Precipitation Climatology Project (GPCP) product, an observation based analysis using satellite observations over oceans and satellite and rain gauge observations over land.  The Monthly analysis extends from 1983 to the near present as a Climate Data Record (CDR) with an extension to the previous month (within ~ 12 days of the end of the month) as an Interim CDR, or ICDR.


The development of the GPCP CDR products (Monthly and finer time scales) is supported by NASA’s MEaSUREs program.  The GPCP Monthly ICDR was developed and its routine calculation is supported by NOAA’s National Center for Environmental Information (NCEI). GPCP products are available at NASA’s Goddard Earth Sciences Data and Information Services Center (GES DISC) and from NOAA NCEI.


The following references describe GPCP products in detail and provide additional research results using GPCP by the authors of this summary:


GPCP V3.2 paper:

Huffman, G. J. and R. Adler, A. Behrangi, D. Bolvin, E. Nelkin, G.Gu and M. Ehsani, 2023.  The New Version 3.2 Global Precipitation Climatology Project (GPCP) Monthly and Daily Precipitation Products.  J. Climate, 36, 7635- 7655. DOI: 10.1175/JCLI-D-23-0123.1. 

GPCP V2.3 paper:

Adler, R., M. Sapiano, G. Huffman, J. Wang, G. Gu, D. Bolvin, L. Chiu, U. Schneider, A. Becker, E. Nelkin, P. Xie, R. Ferraro, D. Shin, 2018.  The Global Precipitation Climatology Project (GPCP) Monthly Analysis (New Version 2.3) and a Review of 2017 Global Precipitation. Atmosphere.  9(4), 138; doi:10.3390/atmos9040138


Other references:Adler, R., G. Gu, M. Sapiano, J. Wang, G. Huffman 2017. Global Precipitation: Means, Variations and Trends During the Satellite Era (1979-2014). Surveys in Geophysics 38: 679-699, doi:10.1007/s10712-017-9416-4 Adler, R. F., G. Gu, G. J. Huffman, R. P. Sapiano and J. Wang, 2020: GPCP and the Global Characteristics of Precipitation. In Satellite Precipitation Measurement, Vol. 2, Chapter 35, 677-697. Advances in Global Change Research, 69, Springer Nature, doi:10.1007/978-3-030-35798-6_11. 

Gu, G., and R. Adler, 2023. Observed Variability and Trends in Global Precipitation During 1979-2020. Climate Dynamics, 61, 131-150.


Adler, R. and G. Gu, 2024. Global Precipitation for the Year 2023 and How It Relates to Longer Term Variations and Trends. Atmosphere, 15(5). 10.3390/atmos15050535.


Gu, G. and R. Adler, 2024. Variability and Trends in Tropical Precipitation Intensity in Observations and Climate Models.  Climate Dynamics, https://doi.org/10.1007/s00382-024-07287-y.

Picture of Dr. Robert Adler

Dr. Robert Adler

Robert Adler’s research at ESSIC/UMD focuses on the analysis of precipitation observations from space on global and regional scales, examining precipitation variations on inter-annual to climate-trend scales. He came to ESSIC in 2008 after a 35-year career at NASA’s Goddard Space Flight Center where he served as NASA’s Tropical Rainfall Measuring Mission (TRMM) Project Scientist from 2000-2007, in addition to holding other research and management positions. He has also led, and is still involved with, the Global Precipitation Climatology Project (GPCP) and is one of the developers of the TRMM Multi-satellite Precipitation Analysis (TMPA), the original microwave multi-satellite precipitation analysis. He also led efforts to study and monitor precipitation extremes and associated floods and landslides on a global scale. Dr. Adler has published over 180 papers in scientific journals on these topics. He is a Fellow of the American Meteorological Society and has received NASA Goddard’s William Nordberg Award for Earth Science and NASA Medals for Outstanding Leadership and for Exceptional Scientific Achievement. He received his B.S. and M.S. from Penn State and his Ph.D. from Colorado State University.

Picture of Dr. Guojun Gu

Dr. Guojun Gu

Guojun Gu’s research at ESSIC/UMD focuses on analyzing and exploring global precipitation variations and changes on interannual/interdecadal to climate-trend scales by means of satellite-based observations and climate model outputs. Dr. Gu has published over 60 papers in the field. He received his B.S. from Nanjing University and his Ph.D. from University of Miami.