")
Headlines:
- La Nina weakens, but aspects of rainfall anomaly pattern still evident
- Flooding in Hawaii consistent with La Nina pattern
- Still dry across southern tier of U.S. with wildfires on the Plains
- Pacific SST patterns changing quickly toward possible El Nino; rainfall patterns will follow
The current GPCP analysis being used for this discussion may be negatively affected by relatively weak sampling over the ocean by the F17 SSMIS instrument which serves as a main calibrator in the analysis scheme. The anomaly patterns are certainly valid, but ocean total anomaly values over this month and recent months may be questionable. Steps are being taken to identify and rectify this situation.
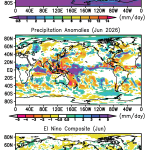
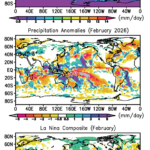
Its “déjà vu all over again” for this March with La Nina SSTs weakening to a RNino3.4 of only -0.5K, barely La Nina. But, the rainfall anomaly pattern across the Indian/Pacific Ocean tropics still shows distinct La Nina characteristics, although even those are now weakening. The typical heavy rain areas in the western Pacific are shifting a little to the east (see Fig. 1, top panel) and there are some indications of a double ITCZ across the central and eastern Pacific. And from that northern hemisphere branch of the Pacific ITCZ a northward extension at about 165°W shows a trail up over Hawaii.
The anomaly chart (Fig. 1, middle panel) indicates that the monthly rainfall over the Hawaii Islands was very much above the climatological mean and resulted in flooding on Oahu and other Hawaii locations. The heavy rains were associated with sub-tropical “Kona Lows” tapping the tropical moisture. The anomaly map shows the mid-Pacific (still) distinct negative anomaly at and to the south of the Equator. Both ends of this north-south couplet are also evident in the La Nina composite for March, indicating that the above normal rain in the Hawaii vicinity is typical of the La Nina regime.
The usual La Nina-typical positive anomaly over the Maritime Continent, however, has shifted a little to the east as the westerly-wind bursts across the area may herald a next ENSO phase. Australia remains generally wet (with TC’s along its northern coast) and the Indian Ocean dry, with eastern Africa wet as part of the up/down La Nina features across the zone. Compare with the composite map (Fig. 1, bottom panel).
Europe was dry from France to Russia, but the Middle East was wetter than normal. The U.S. was dry across its southern half, again a La Nina feature.
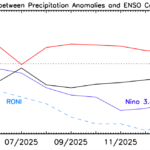
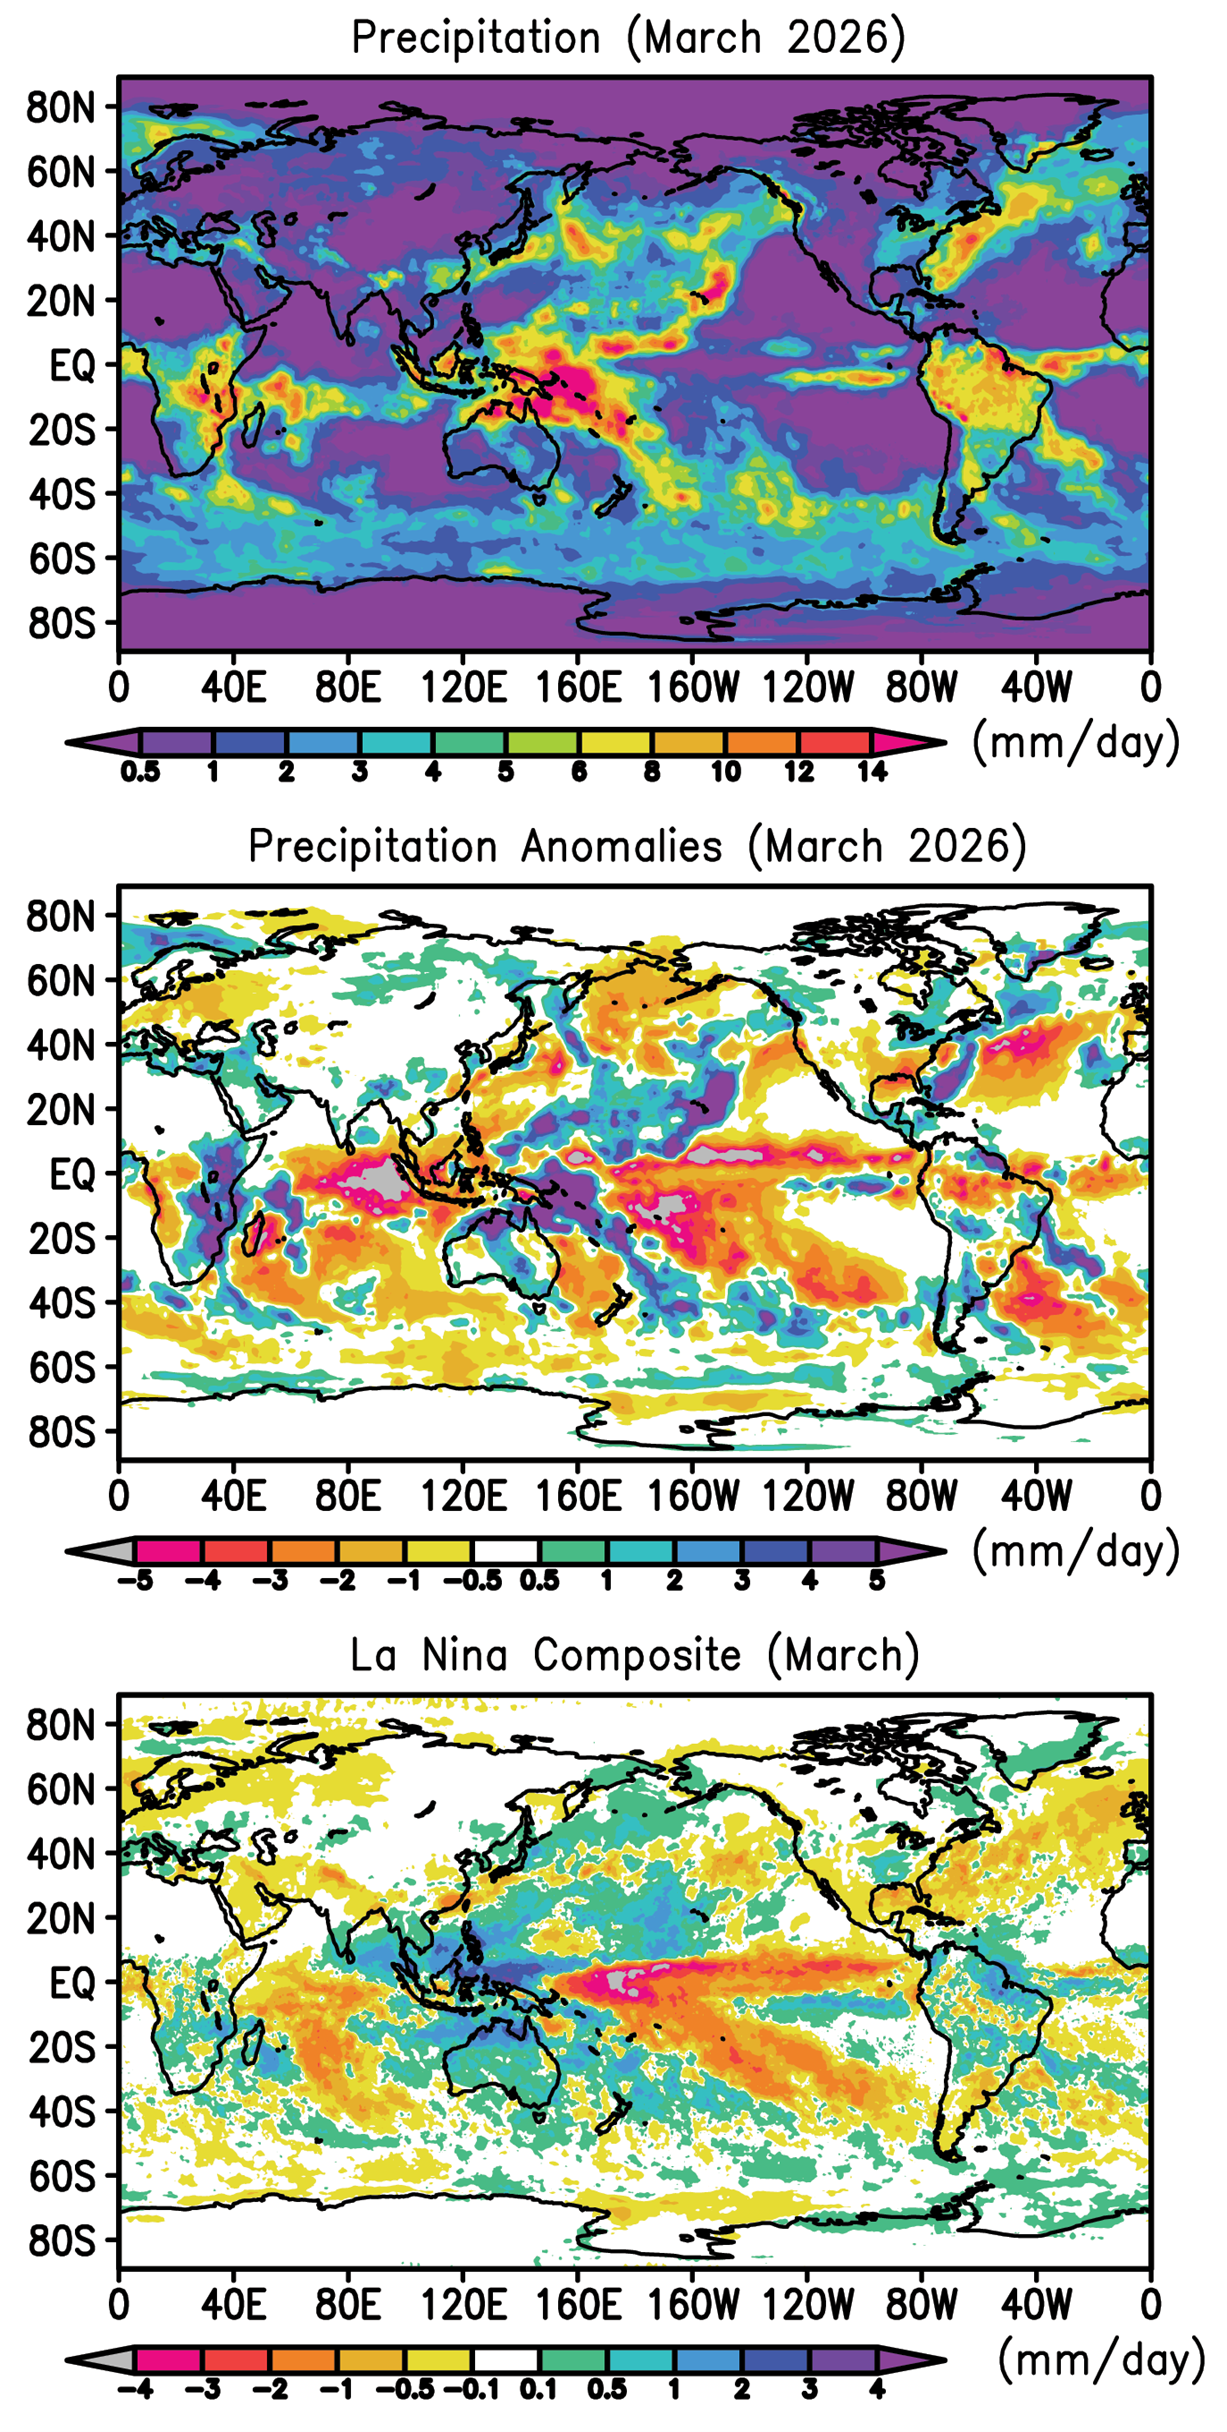
Figure 2 again displays the spatial correlation over the last year between the tropical anomaly pattern for this month and the La Nina and El Nino composite patterns for their respective months. The La Nina correlation for this March is still small, but remains positive reflecting the continued weak La Nina look to the tropical rainfall pattern. It will be interesting to watch the change in the coming months as the expected El Nino forms and the resulting SST anomalies work their effect on the rainfall pattern. The rainfall anomaly pattern typically lags the SST pattern by about a month.
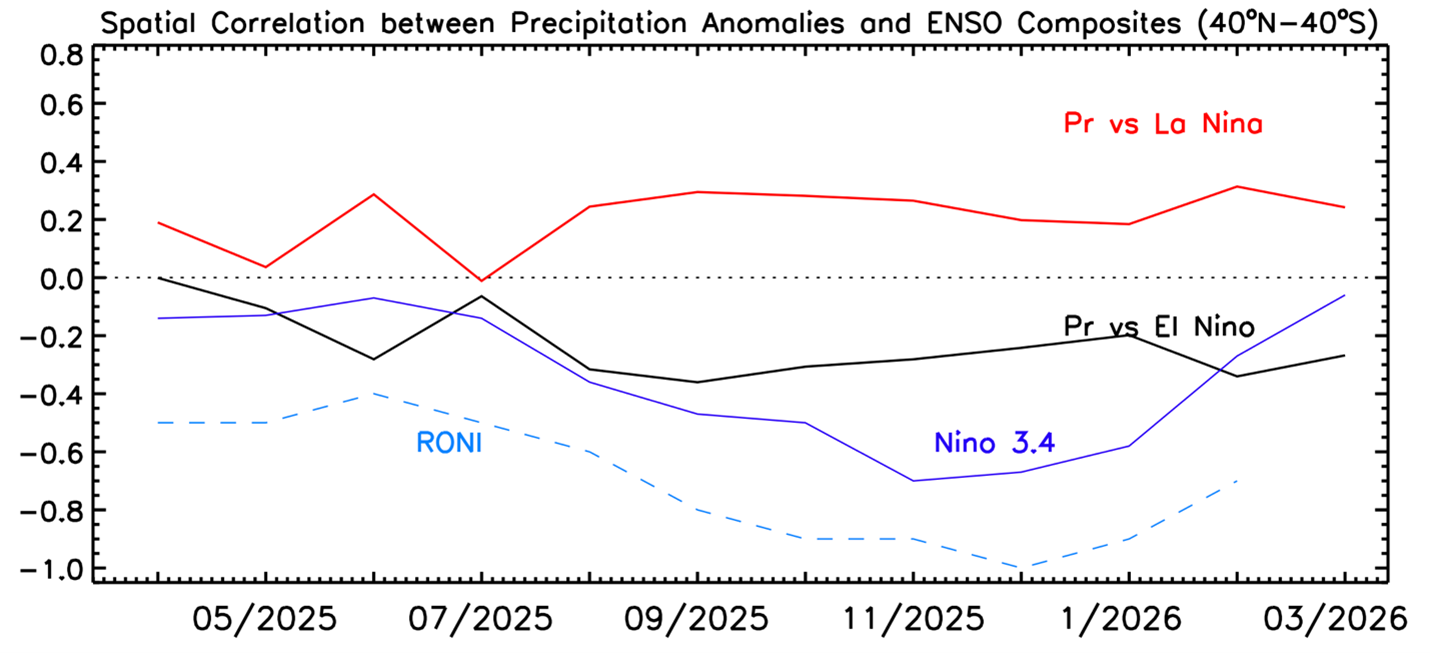
Table 1 gives the global totals for this March and shows the global total below the mean significantly, with the ocean total below and the land value higher than their climatological mean, as expected under La Nina conditions.
Table 1 Global precipitation and anomalies in March 2026.
| Mean Precipitation (March 1983-2025) | Precipitation (March 2026) | Precipitation anomaly (March 2026) |
Land+ocean | 2.80 | 2.62 | -0.18 |
Land | 2.13 | 2.32 | +0.19 |
Ocean | 3.08 | 2.74 | -0.34 |
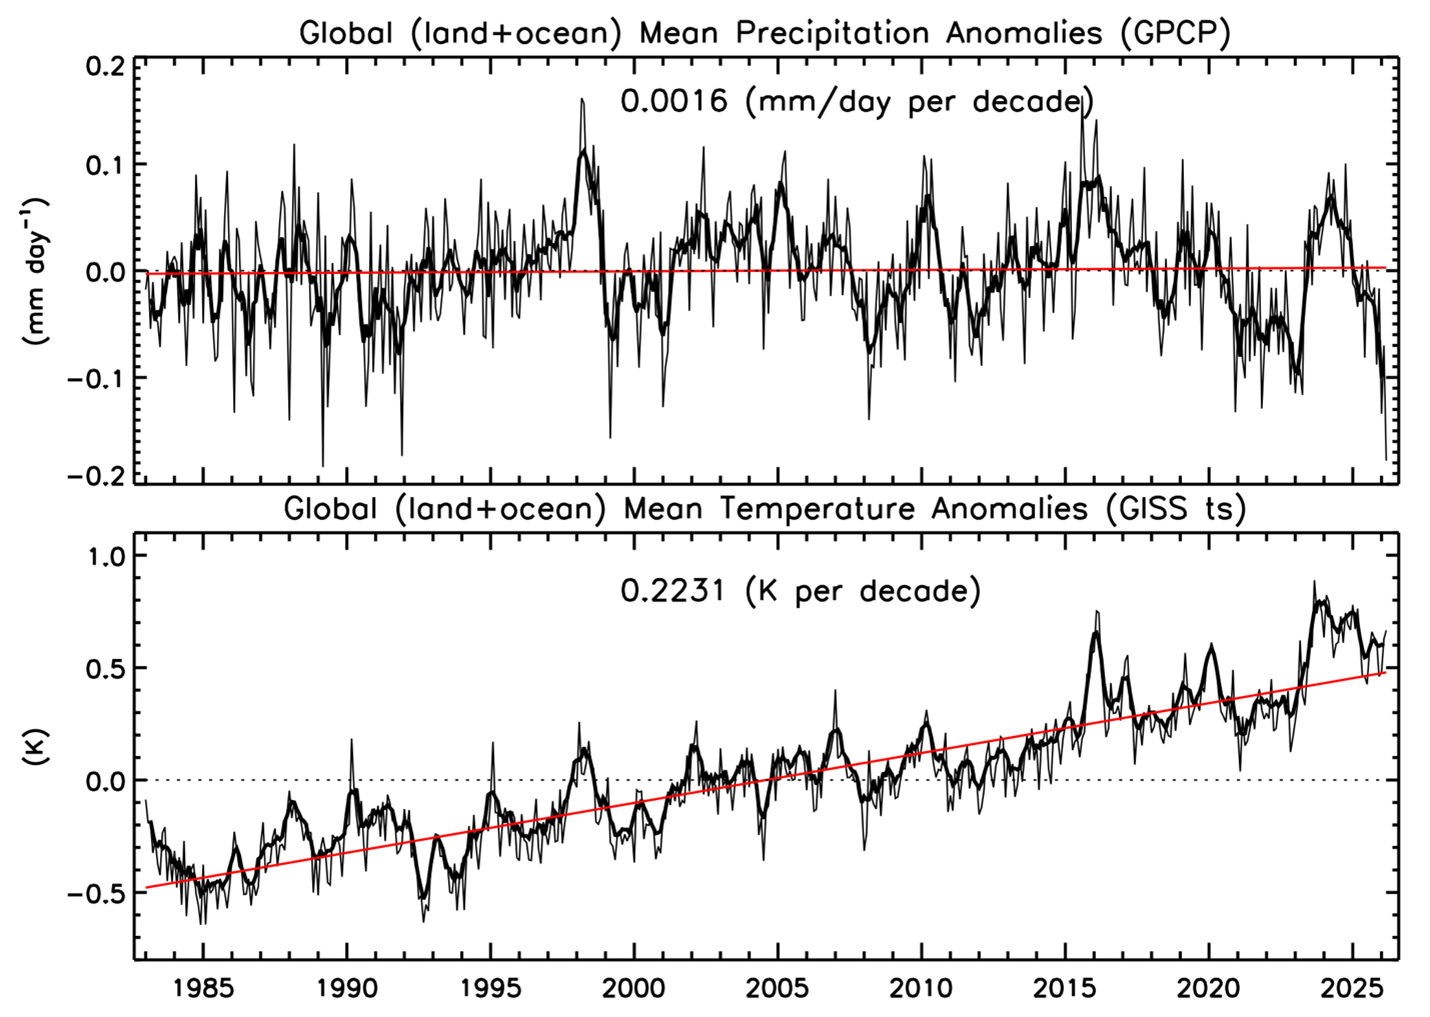
As we likely move from La Nina to an El Nino mode over the next few months the ocean temperature in the tropics will increase and the precipitation pattern will change and likely produce a positive total ocean precipitation anomaly, reversing the current La Nina situation. While the current global surface temperature signal is above its long-term trend line even during the recent and current La Nina (an unusual feature in the long-term record) (see Fig. 3), it is likely that the surface temperature will increase even further if the planet goes into an El Nino and the global precipitation anomaly will go from the recent global negative anomaly to be on the positive side. If indeed the forecast El Nino comes to fruition, it will be interesting to follow the large-scale precipitation evolution.
BACKGROUND
The Global Precipitation Climatology Project (GPCP)
This global precipitation summary is based on V3.2 of the Monthly Global Precipitation Climatology Project (GPCP) product, an observation based analysis using satellite observations over oceans and satellite and rain gauge observations over land. The Monthly analysis extends from 1983 to the near present as a Climate Data Record (CDR) with an extension to the previous month (within ~ 12 days of the end of the month) as an Interim CDR, or ICDR.
The development of the GPCP CDR products (Monthly and finer time scales) is supported by NASA’s MEaSUREs program. The GPCP Monthly ICDR was developed and its routine calculation is supported by NOAA’s National Center for Environmental Information (NCEI). GPCP products are available at NASA’s Goddard Earth Sciences Data and Information Services Center (GES DISC) and from NOAA NCEI.
The following references describe GPCP products in detail and provide additional research results using GPCP by the authors of this summary:
GPCP V3.2 paper:
Huffman, G. J. and R. Adler, A. Behrangi, D. Bolvin, E. Nelkin, G.Gu and M. Ehsani, 2023. The New Version 3.2 Global Precipitation Climatology Project (GPCP) Monthly and Daily Precipitation Products. J. Climate, 36, 7635- 7655. DOI: 10.1175/JCLI-D-23-0123.1.
GPCP V2.3 paper:
Adler, R., M. Sapiano, G. Huffman, J. Wang, G. Gu, D. Bolvin, L. Chiu, U. Schneider, A. Becker, E. Nelkin, P. Xie, R. Ferraro, D. Shin, 2018. The Global Precipitation Climatology Project (GPCP) Monthly Analysis (New Version 2.3) and a Review of 2017 Global Precipitation. Atmosphere. 9(4), 138; doi:10.3390/atmos9040138
Other references: Adler, R., G. Gu, M. Sapiano, J. Wang, G. Huffman 2017. Global Precipitation: Means, Variations and Trends During the Satellite Era (1979-2014). Surveys in Geophysics 38: 679-699, doi:10.1007/s10712-017-9416-4 Adler, R. F., G. Gu, G. J. Huffman, R. P. Sapiano and J. Wang, 2020: GPCP and the Global Characteristics of Precipitation. In Satellite Precipitation Measurement, Vol. 2, Chapter 35, 677-697. Advances in Global Change Research, 69, Springer Nature, doi:10.1007/978-3-030-35798-6_11.
Gu, G., and R. Adler, 2023. Observed Variability and Trends in Global Precipitation During 1979-2020. Climate Dynamics, 61, 131-150.
Adler, R. and G. Gu, 2024. Global Precipitation for the Year 2023 and How It Relates to Longer Term Variations and Trends. Atmosphere, 15(5). 10.3390/atmos15050535.
Gu, G. and R. Adler, 2024. Variability and Trends in Tropical Precipitation Intensity in Observations and Climate Models. Climate Dynamics, https://doi.org/10.1007/s00382-024-07287-y.