Headlines:
- The El Nino continues with increasing Nino3.4 values, but with roughly the same intensity of tropical rainfall patterns.
- Drought and wildfires occurring over Indonesia and surrounding land areas with the very intense dry anomaly related to the El Nino.
- Excessive rain and flooding in southwest U.S. and Florida match the El Nino composite.
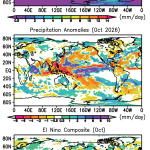
The ongoing El Nino is affecting the rainfall pattern across the tropics and beyond. The mean map for this October (Fig. 1, top panel) shows a total break in the ITCZ over New Guinea with low rain totals in the region. To the east in the central and eastern Pacific the ITCZ is intense and in the central Pacific the beginnings of the SPCZ are below the Equator and extend weakly to the southeast. Other usual climatological features are apparent, but with significant anomalies (Fig. 1, middle panel). The positive anomaly in the central Pacific is very intense, not surprising since the RNino3.4 SST index is +2.5C at the end of October. Surrounding the large positive anomaly is an intense negative anomaly in the shape of a letter V lying on its side. The narrow, east-west negative feature just above the Equator indicates the ITCZ shifting slightly to the south. Over the Maritime Continent, the Philippines and Indochina the dry conditions associated with this aspect of the El Nino version of the Walker circulation are fueling wildfires with smoke-related health issues.
Many of these anomaly features seen this month clearly agree with the El Nino composite in (Fig. 1, bottom panel). However, the Pacific Ocean positive anomaly is further east this month than the composite and so is the negative anomaly over New Guinea. This somewhat easterly shift may have something to do with the observed positive anomaly rainfall over Australia instead of the negative anomaly in the composite and the usual situation with El Nino there.
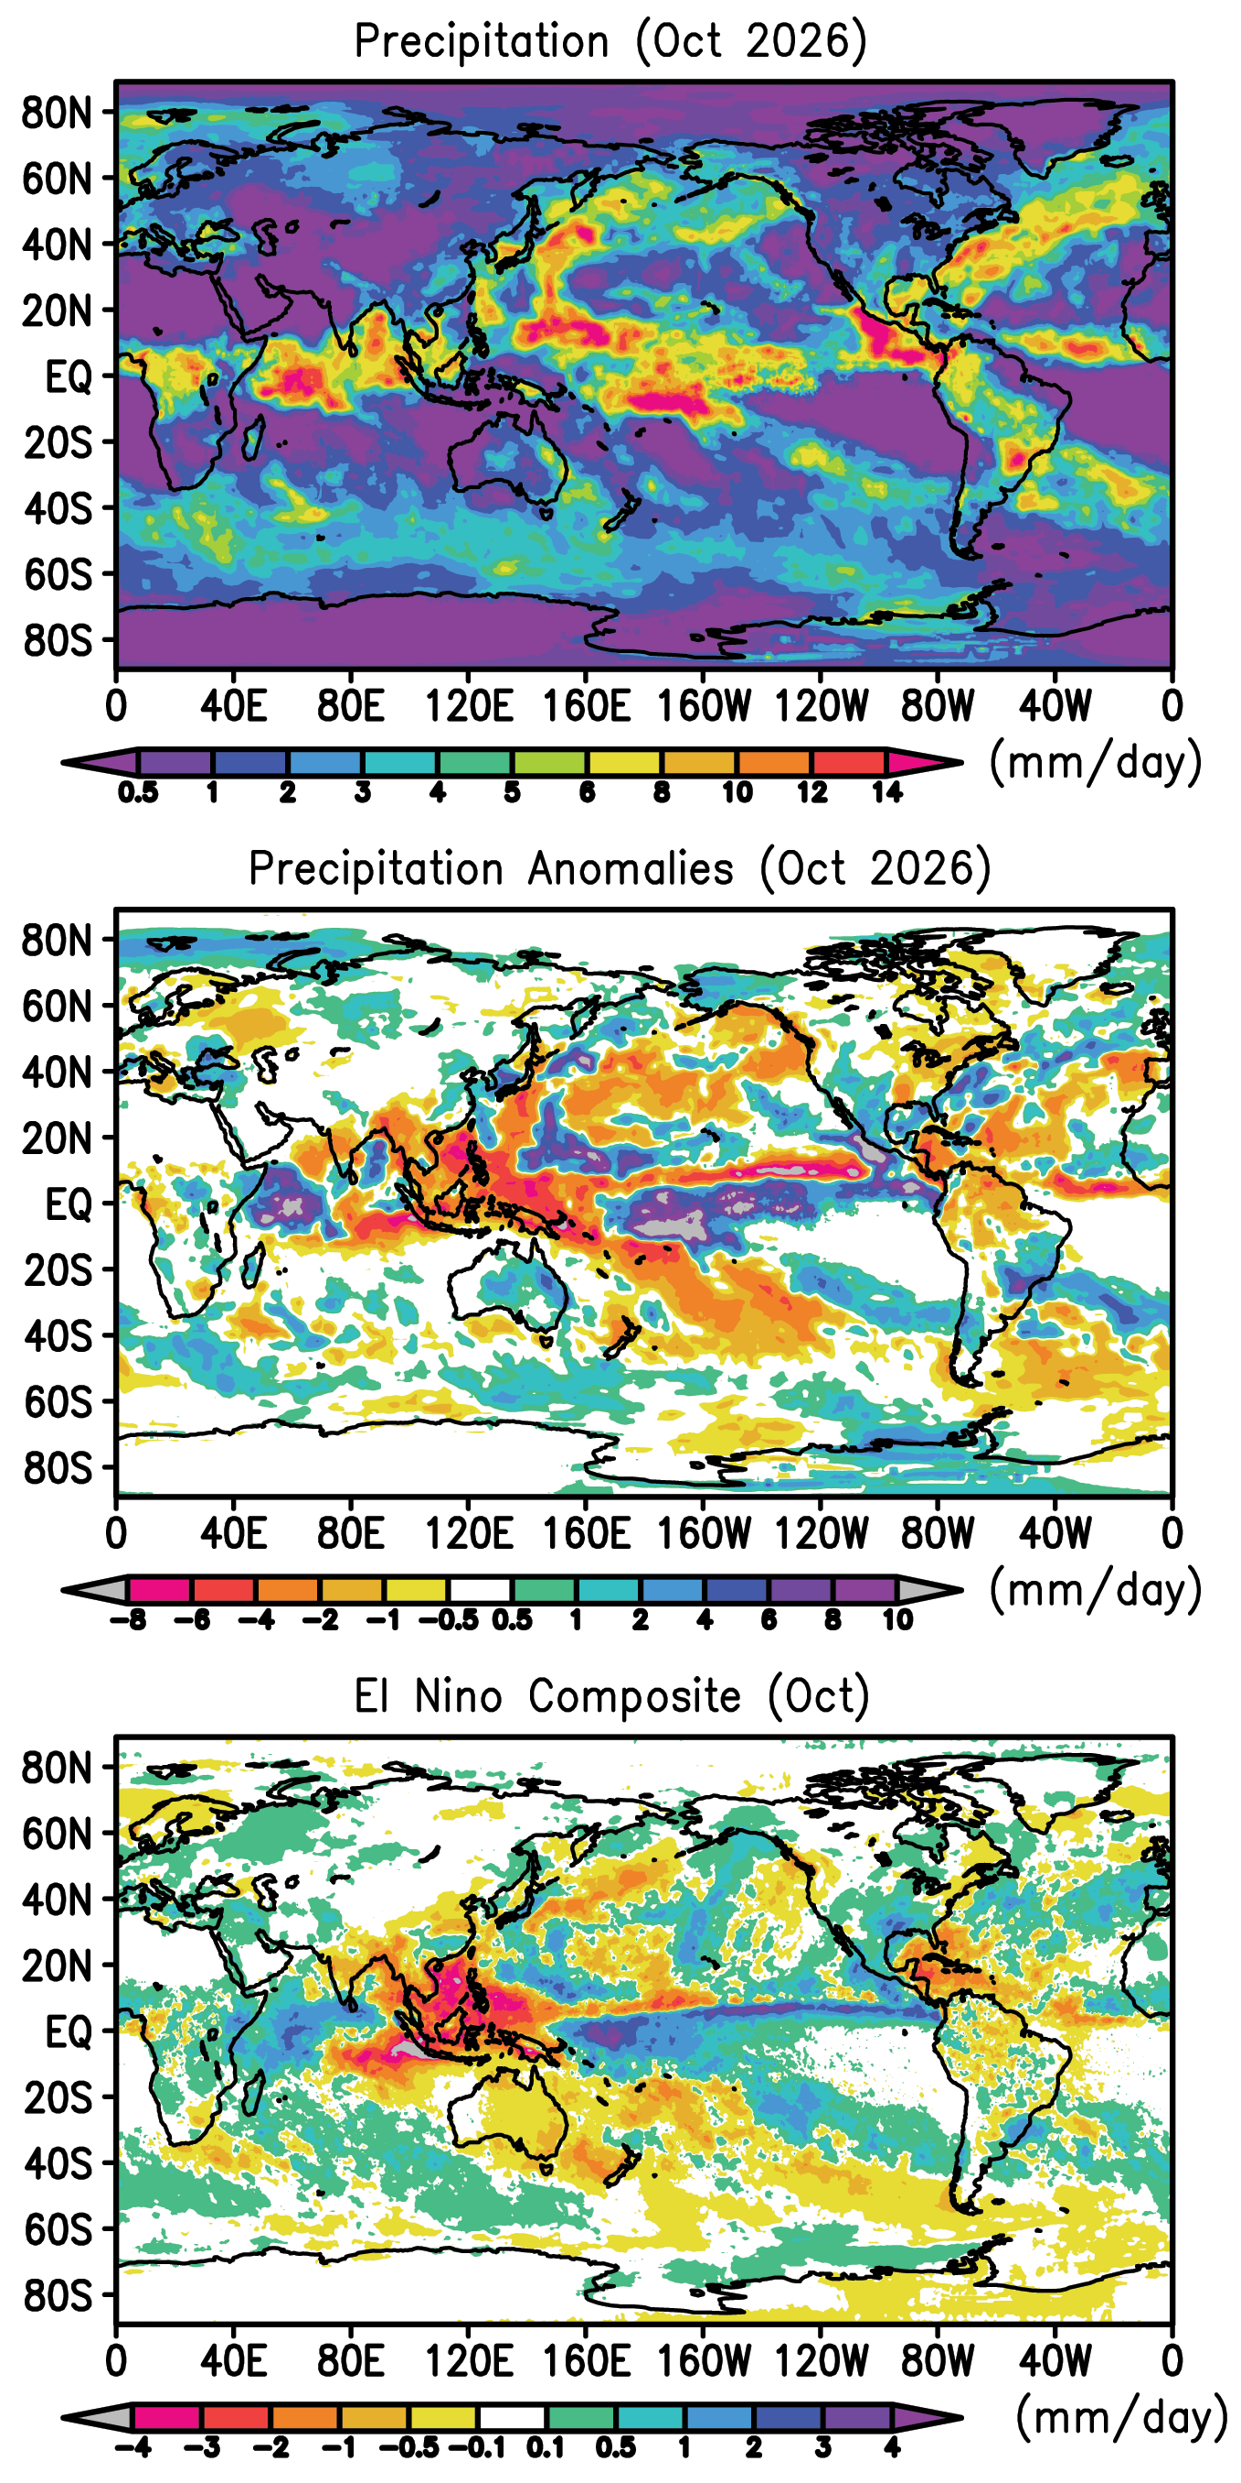
Over the Indian Ocean the October anomaly map is very similar to the composite, especially over India, the Bays of Arabia and Bengal and westward to the Horn of Africa. Southeast Africa has a small dry spot in both maps. The two anomaly patterns over South America are also similar. Over North America most of the western U.S. has a positive anomaly, along with the southeast (especially Florida), similar to the composite and typical of El Nino conditions at this time of year. These positive anomalies over the U.S. were associated with tropical cyclones and their remnants hitting these areas and causing floods in Texas, Oklahoma, Florida and Alabama and later in North Carolina. Also a series of remnants from the East Pacific and Mexico helped produce floods at various time during the month in the southwest U.S. up to Nevada and southwest Colorado (e.g., Durango and Pagosa Springs). The dry slot in the south-central U.S. does not fit match the composite.
In the tropical Atlantic the ITCZ is weak with no hurricanes or other tropical cyclones this month. The negative rain anomaly there matches the composite as does the positive anomaly extending from west Africa westward into the eastern Atlantic. In the South Pacific the anomaly features are oriented northwest to southeast, match the composite and extend to Chile and the Magellan Strait.
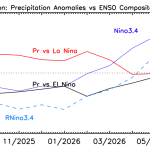
The pattern correlation between this month’s anomalies and the El Nino composite (not shown) show a near constant value of the correlation (near 0.5) over the past few months despite the increasing Nino 3.4 index. Table 1 gives the global totals for this October and has the typical ocean/land opposite anomalies and global positive anomaly typical of El Nino conditions.
Table 1 Global precipitation and anomalies in October 2026.
| Mean Precipitation (October 1983-2025) | Precipitation (October 2026) | Precipitation anomaly (October 2026) |
Land+ocean | 2.80 | 2.87 | +0.07 |
Land | 2.08 | 2.07 | -0.01 |
Ocean | 3.10 | 3.21 | +0.11 |
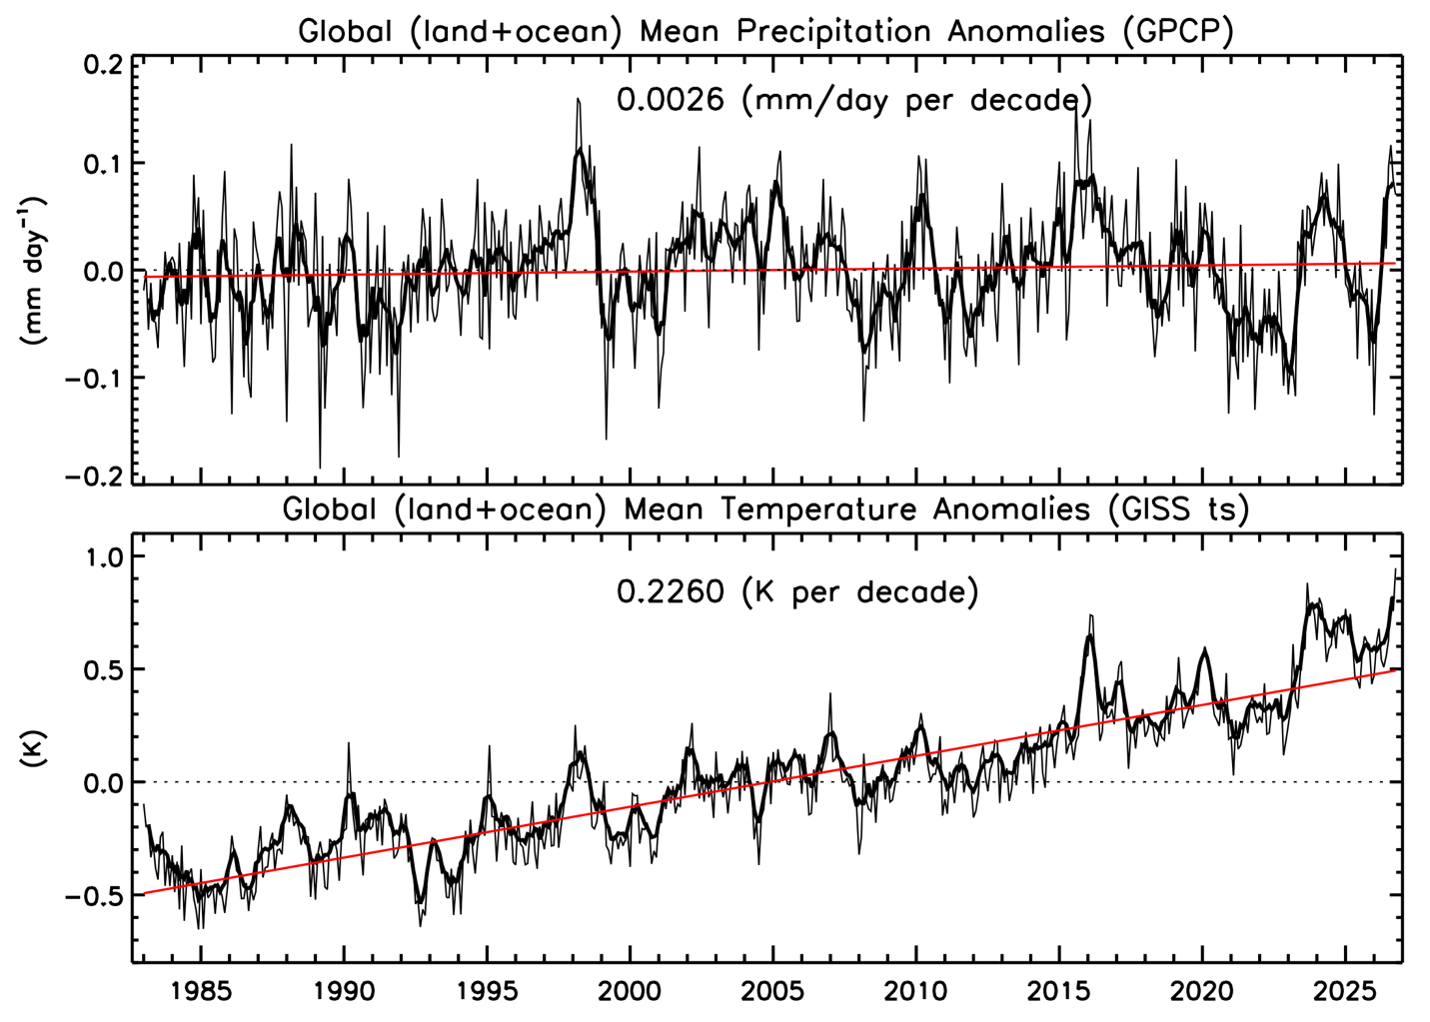
Figure 2 adds another point at the end of time history of global surface temperature and global precipitation, both showing the positive anomaly associated with El Nino. We will be monitoring these numbers over the next months as the El Nino hits a peak and likely dissipates and perhaps switch over to La Nina conditions. Will the Ts stay above the trend line while the P curve goes into negative anomaly? We’ll see.
BACKGROUND
The Global Precipitation Climatology Project (GPCP)
This global precipitation summary is based on V3.2 of the Monthly Global Precipitation Climatology Project (GPCP) product, an observation based analysis using satellite observations over oceans and satellite and rain gauge observations over land. The Monthly analysis extends from 1983 to the near present as a Climate Data Record (CDR) with an extension to the previous month (within ~ 12 days of the end of the month) as an Interim CDR, or ICDR.
The development of the GPCP CDR products (Monthly and finer time scales) is supported by NASA’s MEaSUREs program. The GPCP Monthly ICDR was developed and its routine calculation is supported by NOAA’s National Center for Environmental Information (NCEI). GPCP products are available at NASA’s Goddard Earth Sciences Data and Information Services Center (GES DISC) and from NOAA NCEI as well as ECMWF’s Climate Store.
The following references describe GPCP products in detail and provide additional research results using GPCP by the authors of this summary:
GPCP V3.2 paper:
Huffman, G. J. and R. Adler, A. Behrangi, D. Bolvin, E. Nelkin, G.Gu and M. Ehsani, 2023. The New Version 3.2 Global Precipitation Climatology Project (GPCP) Monthly and Daily Precipitation Products. J. Climate, 36, 7635- 7655. DOI: 10.1175/JCLI-D-23-0123.1.
GPCP V2.3 paper:
Adler, R., M. Sapiano, G. Huffman, J. Wang, G. Gu, D. Bolvin, L. Chiu, U. Schneider, A. Becker, E. Nelkin, P. Xie, R. Ferraro, D. Shin, 2018. The Global Precipitation Climatology Project (GPCP) Monthly Analysis (New Version 2.3) and a Review of 2017 Global Precipitation. Atmosphere. 9(4), 138; doi:10.3390/atmos9040138
Other references:Adler, R., G. Gu, M. Sapiano, J. Wang, G. Huffman 2017. Global Precipitation: Means, Variations and Trends During the Satellite Era (1979-2014). Surveys in Geophysics 38: 679-699, doi:10.1007/s10712-017-9416-4 Adler, R. F., G. Gu, G. J. Huffman, R. P. Sapiano and J. Wang, 2020: GPCP and the Global Characteristics of Precipitation. In Satellite Precipitation Measurement, Vol. 2, Chapter 35, 677-697. Advances in Global Change Research, 69, Springer Nature, doi:10.1007/978-3-030-35798-6_11.
Gu, G., and R. Adler, 2023. Observed Variability and Trends in Global Precipitation During 1979-2020. Climate Dynamics, 61, 131-150.
Adler, R. and G. Gu, 2024. Global Precipitation for the Year 2023 and How It Relates to Longer Term Variations and Trends. Atmosphere, 15(5). 10.3390/atmos15050535.
Gu, G. and R. Adler, 2024. Variability and Trends in Tropical Precipitation Intensity in Observations and Climate Models. Climate Dynamics, https://doi.org/10.1007/s00382-024-07287-y.
The GPCP analyses are also used as part of the annual State of the Climate report published in the Bulletin of the AMS, in the Precipitation section ( Ziese, M., R. S. Vose, R. Adler, G. Gu and X. Yin, 2026. Precipitation. [in “State of the Climate in 2025”]. Bull. Amer. Meteor. Soc., 107 (8), S59–S60, https://doi.org/10.1175/BAMS-D-26-0141.1)